PG&E 2011 Annual Report Download - page 24
Download and view the complete annual report
Please find page 24 of the 2011 PG&E annual report below. You can navigate through the pages in the report by either clicking on the pages listed below, or by using the keyword search tool below to find specific information within the annual report.-
 1
1 -
2
-
3
-
4
-
5
-
6
-
7
-
8
-
9
-
10
-
11
-
12
-
13
-
 14
14 -
 15
15 -
 16
16 -
 17
17 -
 18
18 -
 19
19 -
 20
20 -
 21
21 -
 22
22 -
 23
23 -
 24
24 -
 25
25 -
 26
26 -
 27
27 -
 28
28 -
 29
29 -
 30
30 -
 31
31 -
 32
32 -
 33
33 -
 34
34 -
35
-
36
-
37
-
38
-
39
-
40
-
41
-
42
-
43
-
44
-
45
-
46
-
47
-
48
-
49
-
50
-
51
-
52
-
53
-
54
-
55
-
56
-
57
-
58
-
59
-
60
-
61
-
62
-
63
-
64
-
65
-
66
-
67
-
68
-
69
-
70
-
71
-
72
-
73
-
74
-
75
-
76
-
77
-
78
-
79
-
80
-
81
-
82
-
83
-
84
-
85
-
86
-
87
-
88
-
89
-
90
-
91
-
92
-
93
-
94
-
95
-
96
-
97
-
98
-
99
-
100
-
101
-
102
-
103
-
104
-
105
-
106
-
107
-
108
-
109
-
110
-
111
-
112
-
113
-
114
-
115
-
116
-
117
-
118
-
119
-
120
-
121
-
122
-
123
-
124
-
125
-
126
-
127
-
128
 |
 |

As the Utility focuses on improving the safety and reliability of its natural gas and electric operations, and
subject to the outcome of the matters described under ‘‘Natural Gas Matters’’ below, PG&E Corporation expects
that its Board of Directors will maintain the current annual common stock dividend of $1.82 per share in 2012.
Utility
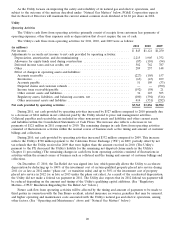
Operating Activities
The Utility’s cash flows from operating activities primarily consist of receipts from customers less payments of
operating expenses, other than expenses such as depreciation that do not require the use of cash.
The Utility’s cash flows from operating activities for 2011, 2010, and 2009 were as follows:
2011 2010 2009
(in millions)
Net income .......................................................... $ 845 $1,121 $1,250
Adjustments to reconcile net income to net cash provided by operating activities:
Depreciation, amortization, and decommissioning ............................ 2,215 1,905 1,752
Allowance for equity funds used during construction .......................... (87) (110) (94)
Deferred income taxes and tax credits, net ................................. 582 762 787
Other ............................................................ 289 257 148
Effect of changes in operating assets and liabilities:
Accounts receivable ................................................ (227) (105) 157
Inventories ....................................................... (63) (43) 109
Accounts payable .................................................. 51 109 (33)
Disputed claims and customer refunds ................................... ——(700)
Income taxes receivable/payable ....................................... (192) (58) 21
Other current assets and liabilities ...................................... 36 123 305
Regulatory assets, liabilities, and balancing accounts, net ...................... (100) (394) (516)
Other noncurrent assets and liabilities ................................... 414 (331) (282)
Net cash provided by operating activities .................................... $3,763 $3,236 $2,904
During 2011, net cash provided by operating activities increased by $527 million compared to 2010 primarily due
to a decrease of $214 million in net collateral paid by the Utility related to price risk management activities.
Collateral payables and receivables are included in other noncurrent assets and liabilities and other current assets
and liabilities within the Consolidated Statements of Cash Flows. The increase also reflects a decrease in tax
payments of $121 million in 2011 compared to 2010. The remaining changes in cash flows from operating activities
consisted of fluctuations in activities within the normal course of business such as the timing and amount of customer
billings and collections.
During 2010, net cash provided by operating activities increased $332 million compared to 2009. This increase
reflects the Utility’s $700 million payment to the California Power Exchange (‘‘PX’’) in 2009, partially offset by net
tax refunds that the Utility received in 2009 that were higher than the amount received in 2010. (The Utility’s
payment to the PX decreased the Utility’s liability for the remaining net disputed claims made in the Utility’s
Chapter 11 proceeding.) The remaining changes in cash flows from operating activities consisted of fluctuations in
activities within the normal course of business such as collateral and the timing and amount of customer billings and
collections.
On December 17, 2010, the Tax Relief Act was signed into law, which generally allows the Utility to accelerate
depreciation by deducting up to 100% of the investment cost of certain qualified property placed into service during
2011 (or as late as 2012 under ‘‘phase out’’ or transition rules) and up to 50% of the investment cost of property
placed into service in 2012 (or as late as 2013 under the phase out rules). As a result of the accelerated depreciation,
the Utility did not make a federal tax payment in 2011. The Utility also expects that its 2012 federal tax payment will
be reduced depending on the amount and timing of the Utility’s qualifying capital additions. (See ‘‘Regulatory
Matters—CPUC Resolution Regarding the Tax Relief Act’’ below.)
Future cash flow from operating activities will be affected by the timing and amount of payments to be made to
third parties in connection with the San Bruno accident, related insurance recoveries, penalties that may be assessed,
and higher operating and maintenance costs associated with the Utility’s natural gas and electric operations, among
other factors. (See ‘‘Operating and Maintenance’’ above and ‘‘Natural Gas Matters’’ below.)
20