PG&E 2011 Annual Report Download - page 17
Download and view the complete annual report
Please find page 17 of the 2011 PG&E annual report below. You can navigate through the pages in the report by either clicking on the pages listed below, or by using the keyword search tool below to find specific information within the annual report.-
 1
1 -
2
-
3
-
4
-
5
-
6
-
 7
7 -
 8
8 -
 9
9 -
 10
10 -
 11
11 -
 12
12 -
 13
13 -
 14
14 -
 15
15 -
 16
16 -
 17
17 -
 18
18 -
 19
19 -
 20
20 -
 21
21 -
 22
22 -
 23
23 -
 24
24 -
 25
25 -
 26
26 -
 27
27 -
28
-
29
-
30
-
31
-
32
-
33
-
34
-
35
-
36
-
37
-
38
-
39
-
40
-
41
-
42
-
43
-
44
-
45
-
46
-
47
-
48
-
49
-
50
-
51
-
52
-
53
-
54
-
55
-
56
-
57
-
58
-
59
-
60
-
61
-
62
-
63
-
64
-
65
-
66
-
67
-
68
-
69
-
70
-
71
-
72
-
73
-
74
-
75
-
76
-
77
-
78
-
79
-
80
-
81
-
82
-
83
-
84
-
85
-
86
-
87
-
88
-
89
-
90
-
91
-
92
-
93
-
94
-
95
-
96
-
97
-
98
-
99
-
100
-
101
-
102
-
103
-
104
-
105
-
106
-
107
-
108
-
109
-
110
-
111
-
112
-
113
-
114
-
115
-
116
-
117
-
118
-
119
-
120
-
121
-
122
-
123
-
124
-
125
-
126
-
127
-
128
 |
 |

The Utility’s operating revenues for natural gas transmission and storage services in 2012, 2013, and 2014 are
expected to increase as authorized by the CPUC in the 2011 GT&S rate case. Additionally, the Utility’s revenues for
natural gas distribution services in 2012 and 2013 excluding pass through costs are expected to increase as authorized
by the CPUC in the 2011 GRC. The Utility’s gas operating revenues for future years also will be impacted by
changes in the cost of natural gas, natural gas throughput volume, and other factors.
Cost of Natural Gas
The Utility’s cost of natural gas includes the procurement, storage, and transportation of natural gas. The cost of
natural gas excludes the cost of transportation on the Utility’s owned pipeline, which is included in operating and
maintenance expense in the Consolidated Statements of Income. The Utility’s cost of natural gas also includes
realized gains and losses on price risk management activities. (See Note 10 of the Notes to the Consolidated
Financial Statements.) The Utility’s cost of natural gas is passed through to customers.
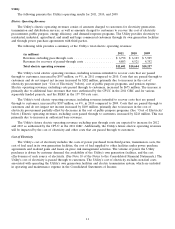
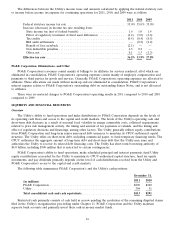
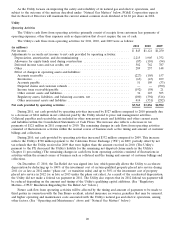
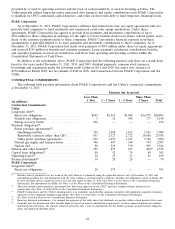
The following table provides a summary of the Utility’s cost of natural gas:
2011 2010 2009
(in millions)
Cost of natural gas sold ................................... $1,136 $1,119 $1,130
Transportation cost of natural gas sold ......................... 181 172 161
Total cost of natural gas ................................... $1,317 $1,291 $1,291
Average cost per Mcf of natural gas sold ....................... $ 4.49 $ 4.69 $ 4.47
Total natural gas sold (in millions of Mcf)(1) ..................... 253 249 253
(1) One thousand cubic feet
The Utility’s total cost of natural gas increased by $26 million, or 2%, in 2011 compared to 2010. The increase
was primarily due to the absence of a $49 million refund the Utility received in 2010 for pass through to customers
as part of a litigation settlement. The increase was partially offset by a decrease in procurement costs resulting from
a decline in the average market price of natural gas during 2011.
The Utility’s total cost of natural gas decreased by less than $1 million in 2010 compared to 2009. The Utility
received $49 million in the first quarter of 2010 to be refunded to customers as part of a litigation settlement arising
from the manipulation of the natural gas market by third parties during 1999 through 2002. The decrease resulting
from the settlement was partially offset by an increase in transportation costs and an increase in procurement costs
due to increases in the average market price of natural gas purchased.
The Utility’s future cost of natural gas will be affected by the market price of natural gas and changes in
customer demand. In addition, the Utility’s future cost of natural gas may be affected by federal or state legislation
or rules to regulate the GHG emissions from the Utility’s natural gas transportation and distribution facilities and
from natural gas consumed by the Utility’s customers.
Operating and Maintenance
Operating and maintenance expenses consist mainly of the Utility’s costs to operate and maintain its electricity
and natural gas facilities, customer billing and service expenses, the cost of public purpose programs, and
administrative and general expenses. The Utility’s ability to earn its authorized rate of return depends in large part
on the success of its ability to manage expenses and to achieve operational and cost efficiencies.
The Utility’s operating and maintenance expenses (including costs currently passed through to customers)
increased by $1,027 million, or 23%, in 2011 compared to 2010. Costs that are passed through to customers and do
not impact net income increased by $210 million primarily due to pension expense, public purpose programs, and
meter reading.
Excluding costs currently passed through to customers, operating and maintenance expenses increased by
$817 million in 2011 compared to 2010, primarily due to a $456 million increase in costs for natural gas matters. (See
‘‘Natural Gas Matters’’ below.) Total costs associated with natural gas matters were $739 million in 2011, which
included $483 million to conduct hydrostatic pressure tests and perform other pipeline-related activities, $200 million
for estimated penalties related to the CPUC’s pending investigations and the Utility’s self-reported violations, and
$155 million for estimated third-party claims related to the San Bruno accident, that were partially offset by
13