PG&E 2011 Annual Report Download - page 15
Download and view the complete annual report
Please find page 15 of the 2011 PG&E annual report below. You can navigate through the pages in the report by either clicking on the pages listed below, or by using the keyword search tool below to find specific information within the annual report.-
 1
1 -
2
-
3
-
4
-
 5
5 -
 6
6 -
 7
7 -
 8
8 -
 9
9 -
 10
10 -
 11
11 -
 12
12 -
 13
13 -
 14
14 -
 15
15 -
 16
16 -
 17
17 -
 18
18 -
 19
19 -
 20
20 -
 21
21 -
 22
22 -
 23
23 -
 24
24 -
 25
25 -
26
-
27
-
28
-
29
-
30
-
31
-
32
-
33
-
34
-
35
-
36
-
37
-
38
-
39
-
40
-
41
-
42
-
43
-
44
-
45
-
46
-
47
-
48
-
49
-
50
-
51
-
52
-
53
-
54
-
55
-
56
-
57
-
58
-
59
-
60
-
61
-
62
-
63
-
64
-
65
-
66
-
67
-
68
-
69
-
70
-
71
-
72
-
73
-
74
-
75
-
76
-
77
-
78
-
79
-
80
-
81
-
82
-
83
-
84
-
85
-
86
-
87
-
88
-
89
-
90
-
91
-
92
-
93
-
94
-
95
-
96
-
97
-
98
-
99
-
100
-
101
-
102
-
103
-
104
-
105
-
106
-
107
-
108
-
109
-
110
-
111
-
112
-
113
-
114
-
115
-
116
-
117
-
118
-
119
-
120
-
121
-
122
-
123
-
124
-
125
-
126
-
127
-
128
 |
 |

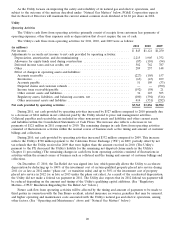
Utility
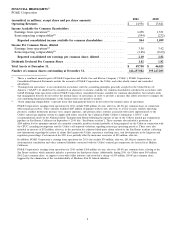
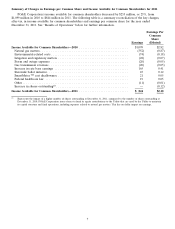
The following presents the Utility’s operating results for 2011, 2010, and 2009.
Electric Operating Revenues
The Utility’s electric operating revenues consist of amounts charged to customers for electricity generation,
transmission and distribution services, as well as amounts charged to customers to recover the cost of electricity
procurement, public purpose, energy efficiency, and demand response programs. The Utility provides electricity to
residential, industrial, agricultural, and small and large commercial customers through its own generation facilities
and through power purchase agreements with third parties.
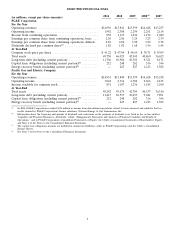
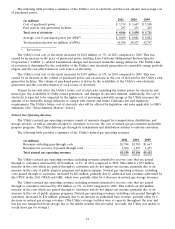
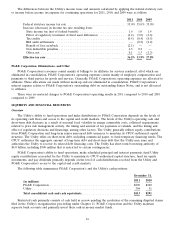
The following table provides a summary of the Utility’s total electric operating revenues:
2011 2010 2009
(in millions)
Revenues excluding pass-through costs ...................... $ 6,798 $ 6,123 $ 5,905
Revenues for recovery of passed-through costs ................ 4,803 4,521 4,352
Total electric operating revenues .......................... $11,601 $10,644 $10,257
The Utility’s total electric operating revenues, including revenues intended to recover costs that are passed
through to customers, increased by $957 million, or 9%, in 2011 compared to 2010. Costs that are passed through to
customers and do not impact net income increased by $282 million, primarily due to increases in the cost of
electricity procurement (see ‘‘Cost of Electricity’’ below), cost of public purpose programs, and pension expense.
Electric operating revenues, excluding costs passed through to customers, increased by $675 million. The increase is
primarily due to additional base revenues that were authorized by the CPUC in the 2011 GRC and for various
separately funded projects, and the FERC in the 13th TO rate case.
The Utility’s total electric operating revenues, including revenues intended to recover costs that are passed
through to customers, increased by $387 million, or 4%, in 2010 compared to 2009. Costs that are passed through to
customers and do not impact net income increased by $169 million, primarily due to increases in the cost of
electricity procurement partially offset by decreases in the cost of public purpose programs. (See ‘‘Cost of Electricity’’
below.) Electric operating revenues, excluding costs passed through to customers, increased by $218 million. This was
primarily due to increases in authorized base revenues.
The Utility’s future electric operating revenues excluding pass through costs are expected to increase for 2012
and 2013 as authorized by the CPUC in the 2011 GRC. Additionally, the Utility’s future electric operating revenues
will be impacted by the cost of electricity and other costs that are passed through to customers.
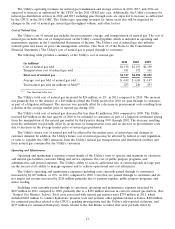
Cost of Electricity
The Utility’s cost of electricity includes the costs of power purchased from third parties, transmission costs, the
cost of fuel used in its own generation facilities, the cost of fuel supplied to other facilities under power purchase
agreements and realized gains and losses on price risk management activities. The volume of power the Utility
purchases is driven by customer demand, the availability of the Utility’s own generation facilities, and the cost
effectiveness of each source of electricity. (See Note 10 of the Notes to the Consolidated Financial Statements.) The
Utility’s cost of electricity is passed through to customers. The Utility’s cost of electricity excludes non-fuel costs
associated with operating the Utility’s own generation facilities and electric transmission system, which are included
in operating and maintenance expense in the Consolidated Statements of Income.
11