PG&E 2011 Annual Report Download - page 5
Download and view the complete annual report
Please find page 5 of the 2011 PG&E annual report below. You can navigate through the pages in the report by either clicking on the pages listed below, or by using the keyword search tool below to find specific information within the annual report.-
 1
1 -
 2
2 -
 3
3 -
 4
4 -
 5
5 -
 6
6 -
 7
7 -
 8
8 -
 9
9 -
 10
10 -
 11
11 -
 12
12 -
 13
13 -
 14
14 -
 15
15 -
 16
16 -
17
-
18
-
19
-
20
-
21
-
22
-
23
-
24
-
25
-
26
-
27
-
28
-
29
-
30
-
31
-
32
-
33
-
34
-
35
-
36
-
37
-
38
-
39
-
40
-
41
-
42
-
43
-
44
-
45
-
46
-
47
-
48
-
49
-
50
-
51
-
52
-
53
-
54
-
55
-
56
-
57
-
58
-
59
-
60
-
61
-
62
-
63
-
64
-
65
-
66
-
67
-
68
-
69
-
70
-
71
-
72
-
73
-
74
-
75
-
76
-
77
-
78
-
79
-
80
-
81
-
82
-
83
-
84
-
85
-
86
-
87
-
88
-
89
-
90
-
91
-
92
-
93
-
94
-
95
-
96
-
97
-
98
-
99
-
100
-
101
-
102
-
103
-
104
-
105
-
106
-
107
-
108
-
109
-
110
-
111
-
112
-
113
-
114
-
115
-
116
-
117
-
118
-
119
-
120
-
121
-
122
-
123
-
124
-
125
-
126
-
127
-
128
 |
 |

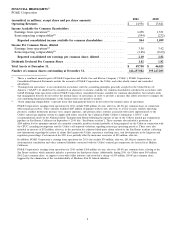
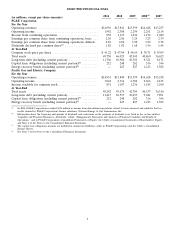
FINANCIAL HIGHLIGHTS(1)
PG&E Corporation
2011 2010
(unaudited, in millions, except share and per share amounts)
Operating Revenues ................................................. $ 14,956 $ 13,841
Income Available for Common Shareholders
Earnings from operations(2) .......................................... 1,438 1,331
Items impacting comparability(3) ...................................... (594) (232)
Reported consolidated income available for common shareholders ............ 844 1,099
Income Per Common Share, diluted
Earnings from operations(2) .......................................... 3.58 3.42
Items impacting comparability(3) ...................................... (1.48) (0.60)
Reported consolidated net earnings per common share, diluted .............. 2.10 2.82
Dividends Declared Per Common Share .................................. 1.82 1.82
Total Assets at December 31, .......................................... $ 49,750 $ 46,025
Number of common shares outstanding at December 31, ...................... 412,257,082 395,227,205
(1) This is a combined annual report of PG&E Corporation and Pacific Gas and Electric Company (‘‘Utility’’). PG&E Corporation’s
Consolidated Financial Statements include the accounts of PG&E Corporation, the Utility, and other wholly owned and controlled
subsidiaries.
(2) ‘‘Earnings from operations’’ is not calculated in accordance with the accounting principles generally accepted in the United States of
America (‘‘GAAP’’). It should not be considered an alternative to income available for common shareholders calculated in accordance with
GAAP. Earnings from operations reflects PG&E Corporation’s consolidated income available for common shareholders, but excludes items
that management believes do not reflect the normal course of operations, in order to provide a measure that allows investors to compare the
core underlying financial performance of the business from one period to another.
(3) ‘‘Items impacting comparability’’ represent items that management believes do not reflect the normal course of operations.
PG&E Corporation’s earnings from operations for 2011 exclude $520 million of costs, after-tax, ($1.30) per common share, in connection
with natural gas matters. These amounts included $287 million of pipeline-related costs, after-tax, to review records, validate operating
pressures, conduct hydrostatic pressure tests, inspect pipelines, and perform other activities associated with safety improvements to the
Utility’s natural gas pipeline system to comply with orders issued by the California Public Utilities Commission (‘‘CPUC’’) and
recommendations made by the National Safety Transportation Board following the rupture of one of the Utility’s natural gas transmission
pipelines in San Bruno, California on September 9, 2010 (the ‘‘San Bruno accident’’). These amounts also included a provision of
$200 million for the minimum amount of reasonably estimable penalties deemed probable of being imposed on the Utility in connection with
the CPUC’s pending investigations and the Utility’s self-reported violations regarding natural gas operating practices. These costs also
included an increase of $92 million, after-tax, in the provision for estimated third-party claims related to the San Bruno accident, reflecting
new information regarding the nature of claims filed against the Utility, experience resolving cases, and developments in the litigation and
regulatory proceedings. Costs incurred for 2011 were partially offset by insurance recoveries of $59 million, after-tax.
In addition, PG&E Corporation’s earnings from operations for 2011 also exclude $74 million, after-tax, ($0.18) per common share, for
environmental remediation and other estimated liabilities associated with the Utility’s natural gas compressor site located near Hinkley,
California.
PG&E Corporation’s earnings from operations for 2010 exclude $168 million of costs, after-tax, ($0.43) per common share, relating to the
San Bruno accident, which primarily includes a provision for third-party claims. Additionally, during 2010, the Utility spent $45 million,
($0.12) per common share, to support a state-wide ballot initiative and recorded a charge of $19 million, ($0.05) per common share,
triggered by the elimination of the tax deductibility of Medicare Part D federal subsidies.
1