PG&E 2011 Annual Report Download - page 19
Download and view the complete annual report
Please find page 19 of the 2011 PG&E annual report below. You can navigate through the pages in the report by either clicking on the pages listed below, or by using the keyword search tool below to find specific information within the annual report.-
 1
1 -
2
-
3
-
4
-
5
-
6
-
7
-
8
-
 9
9 -
 10
10 -
 11
11 -
 12
12 -
 13
13 -
 14
14 -
 15
15 -
 16
16 -
 17
17 -
 18
18 -
 19
19 -
 20
20 -
 21
21 -
 22
22 -
 23
23 -
 24
24 -
 25
25 -
 26
26 -
 27
27 -
 28
28 -
 29
29 -
30
-
31
-
32
-
33
-
34
-
35
-
36
-
37
-
38
-
39
-
40
-
41
-
42
-
43
-
44
-
45
-
46
-
47
-
48
-
49
-
50
-
51
-
52
-
53
-
54
-
55
-
56
-
57
-
58
-
59
-
60
-
61
-
62
-
63
-
64
-
65
-
66
-
67
-
68
-
69
-
70
-
71
-
72
-
73
-
74
-
75
-
76
-
77
-
78
-
79
-
80
-
81
-
82
-
83
-
84
-
85
-
86
-
87
-
88
-
89
-
90
-
91
-
92
-
93
-
94
-
95
-
96
-
97
-
98
-
99
-
100
-
101
-
102
-
103
-
104
-
105
-
106
-
107
-
108
-
109
-
110
-
111
-
112
-
113
-
114
-
115
-
116
-
117
-
118
-
119
-
120
-
121
-
122
-
123
-
124
-
125
-
126
-
127
-
128
 |
 |
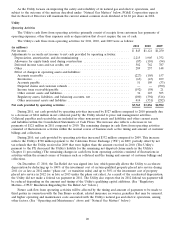
The Utility’s interest income decreased by $24 million, or 73%, in 2010 as compared to 2009, primarily due to
lower interest rates affecting various regulatory balancing accounts and fluctuations in those accounts. In addition,
interest income decreased as compared to 2009 when the Utility received interest income on previously incurred
costs related to the proposed divestiture of its hydroelectric generation facilities.
The Utility’s interest income in future periods will be primarily affected by changes in the balance of funds held
in escrow pending resolution of the Chapter 11 disputed claims, changes in regulatory balancing accounts, and
changes in interest rates. (See Note 13 of the Notes to the Consolidated Financial Statements.)
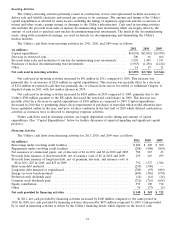
Interest Expense
The Utility’s interest expense increased by $27 million, or 4%, in 2011 as compared to 2010 primarily due to an
increase in outstanding senior notes, partially offset by decreases in the outstanding balance of the energy recovery
bonds (‘‘ERBs’’). (See Note 5 of the Notes to the Consolidated Financial Statements.)
The Utility’s interest expense decreased by $12 million, or 2%, in 2010 as compared to 2009. This decrease was
primarily attributable to decreases in the outstanding balances of the liability for Chapter 11 disputed claims, ERBs,
and various regulatory balancing accounts and to lower interest rates on short-term debt. The decrease was partially
offset by an increase in outstanding senior notes. (See Note 5 of the Notes to the Consolidated Financial
Statements.)
The Utility’s interest expense in future periods will be impacted by changes in interest rates, changes in the
liability for Chapter 11 disputed claims, changes in regulatory balancing accounts and regulatory assets, and changes
in the amount of debt outstanding as long-term debt matures and additional long-term debt is issued. (See ‘‘Liquidity
and Financial Resources’’ below.)
Other Income, Net
The Utility’s other income, net increased by $31 million, in 2011 compared to 2010 when the Utility incurred
costs to support a California ballot initiative that appeared on the June 2010 ballot, which were not recoverable in
rates. The increase was partially offset by a decrease in allowance for equity funds used during construction as the
average balance of construction work in progress was lower in 2011 as compared to 2010.
The Utility’s other income, net decreased by $37 million, or 63%, in 2010 compared to 2009. The decrease was
primarily due to a $45 million increase in other expenses as a result of costs the Utility incurred to support a
California ballot initiative. This expense was partially offset by an increase in allowance for equity funds used during
construction due to higher average balances of construction work in progress in 2010 compared to 2009.
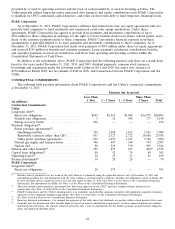
Income Tax Provision
The Utility’s income tax provision decreased by $94 million, or 16%, in 2011 compared to 2010. The effective
tax rates were 36% and 34% for 2011 and 2010, respectively. The effective tax rate for 2011 increased as compared
to 2010, mainly due to non- tax deductible penalties related to natural gas matters, partially offset by a benefit
associated with a loss carryback recorded in 2011 and the reversal of a deferred tax asset attributable to the
Medicare Part D subsidy, which affected the tax provision balance in 2010 with no comparable effect in 2011.
The Utility’s income tax provision increased by $92 million, or 19%, in 2010 compared to 2009. The effective tax
rates were 34% and 28% for 2010 and 2009, respectively. The effective tax rate for 2010 increased as compared to
the same period in 2009 when the Utility recognized state tax benefits arising from tax accounting method changes
and benefits of various audit settlements at higher levels than 2010 settlements. The effective tax rate also increased
due to the reversal of a deferred tax asset in the first quarter of 2010 that had previously been recorded to reflect
the future tax benefits attributable to the Medicare Part D subsidy after 2012, which was eliminated as part of the
federal healthcare legislation passed during March 2010.
15