PG&E 2011 Annual Report Download - page 59
Download and view the complete annual report
Please find page 59 of the 2011 PG&E annual report below. You can navigate through the pages in the report by either clicking on the pages listed below, or by using the keyword search tool below to find specific information within the annual report.
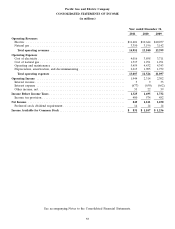
Pacific Gas and Electric Company
CONSOLIDATED STATEMENTS OF INCOME
(in millions)
Year ended December 31,
2011 2010 2009
Operating Revenues
Electric ........................................................ $11,601 $10,644 $10,257
Natural gas ...................................................... 3,350 3,196 3,142
Total operating revenues .......................................... 14,951 13,840 13,399
Operating Expenses
Cost of electricity ................................................. 4,016 3,898 3,711
Cost of natural gas ................................................ 1,317 1,291 1,291
Operating and maintenance .......................................... 5,459 4,432 4,343
Depreciation, amortization, and decommissioning .......................... 2,215 1,905 1,752
Total operating expenses .......................................... 13,007 11,526 11,097
Operating Income .................................................. 1,944 2,314 2,302
Interest income ................................................... 5 9 33
Interest expense .................................................. (677) (650) (662)
Other income, net ................................................. 53 22 59
Income Before Income Taxes ........................................... 1,325 1,695 1,732
Income tax provision ............................................... 480 574 482
Net Income ....................................................... 845 1,121 1,250
Preferred stock dividend requirement ................................... 14 14 14
Income Available for Common Stock ..................................... $ 831 $ 1,107 $ 1,236
See accompanying Notes to the Consolidated Financial Statements.
55


