PG&E 2011 Annual Report Download - page 114
Download and view the complete annual report
Please find page 114 of the 2011 PG&E annual report below. You can navigate through the pages in the report by either clicking on the pages listed below, or by using the keyword search tool below to find specific information within the annual report.-
 1
1 -
2
-
3
-
4
-
5
-
6
-
7
-
8
-
9
-
10
-
11
-
12
-
13
-
14
-
15
-
16
-
17
-
18
-
19
-
20
-
21
-
22
-
23
-
24
-
25
-
26
-
27
-
28
-
29
-
30
-
31
-
32
-
33
-
34
-
35
-
36
-
37
-
38
-
39
-
40
-
41
-
42
-
43
-
44
-
45
-
46
-
47
-
48
-
49
-
50
-
51
-
52
-
53
-
54
-
55
-
56
-
57
-
58
-
59
-
60
-
61
-
62
-
63
-
64
-
65
-
66
-
67
-
68
-
69
-
70
-
71
-
72
-
73
-
74
-
75
-
76
-
77
-
78
-
79
-
80
-
81
-
82
-
83
-
84
-
85
-
86
-
87
-
88
-
89
-
90
-
91
-
92
-
93
-
94
-
95
-
96
-
97
-
98
-
99
-
100
-
101
-
102
-
103
-
 104
104 -
 105
105 -
 106
106 -
 107
107 -
 108
108 -
 109
109 -
 110
110 -
 111
111 -
 112
112 -
 113
113 -
 114
114 -
 115
115 -
 116
116 -
 117
117 -
 118
118 -
 119
119 -
 120
120 -
 121
121 -
 122
122 -
 123
123 -
 124
124 -
125
-
126
-
127
-
128
 |
 |

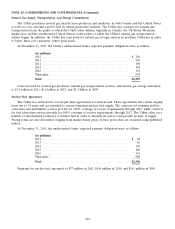
NOTE 15: COMMITMENTS AND CONTINGENCIES (Continued)
Additionally, the Utility has liability insurance from various insurers who provide coverage at different policy
limits that are triggered in sequential order or ‘‘layers.’’ Generally, as the policy limit for a layer is exhausted the
next layer of insurance becomes available. The aggregate amount of this insurance coverage is approximately
$992 million in excess of a $10 million deductible. The Utility submitted insurance claims to certain insurers for the
lower layers and recognized $99 million for insurance recoveries during the year end December 31, 2011. As of
December 31, 2011, $22 million was recorded as a receivable for insurance recoveries in PG&E Corporation’s and
the Utility’s Consolidated Balance Sheets. Although the Utility believes that a significant portion of costs incurred for
third-party claims relating to the San Bruno accident will ultimately be recovered through its insurance, it is unable
to predict the amount and timing of additional insurance recoveries.
Environmental Remediation Contingencies
The Utility has been, and may be required to pay for environmental remediation at sites where it has been, or
may be, a potentially responsible party under federal and state environmental laws. These sites include former
manufactured gas plant (‘‘MGP’’) sites, power plant sites, gas gathering sites, sites where natural gas compressor
stations are located, and sites used by the Utility for the storage, recycling, or disposal of potentially hazardous
substances. Under federal and California laws, the Utility may be responsible for remediation of hazardous
substances even if it did not deposit those substances on the site.
Given the complexities of the legal and regulatory environment and the inherent uncertainties involved in the
early stages of a remediation project, the process for estimating remediation liabilities is subjective and requires
significant judgment. The Utility records an environmental remediation liability when site assessments indicate that
remediation is probable and it can reasonably estimate the loss within a range of possible amounts. The Utility
records an environmental remediation liability based on the lower end of the range of estimated costs, unless an
amount within the range is a better estimate than any other amount. Amounts recorded are not discounted to their
present value.
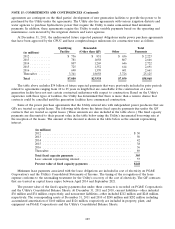
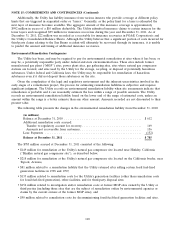
The following table presents the changes in the environmental remediation liability from December 31, 2010:
(in millions)
Balance at December 31, 2010 ............................................ $612
Additional remediation costs accrued:
Transfer to regulatory account for recovery .................................. 169
Amounts not recoverable from customers ................................... 156
Less: Payments ....................................................... (152)
Balance at December 31, 2011 ............................................ $ 785
The $785 million accrued at December 31, 2011 consisted of the following:
• $149 million for remediation at the Utility’s natural gas compressor site located near Hinkley, California
(‘‘Hinkley natural gas compressor site’’), as described below;
• $218 million for remediation at the Utility’s natural gas compressor site located on the California border, near
Topock, Arizona;
• $81 million related to a remediation liability that the Utility retained after selling certain fossil fuel-fired
generation facilities in 1998 and 1999;
• $133 million related to remediation costs for the Utility’s generation facilities (other than remediation costs
for fossil fuel-fired generation), other facilities, and for third-party disposal sites;
• $154 million related to investigation and/or remediation costs at former MGP sites owned by the Utility or
third parties (including those sites that are the subject of remediation orders by environmental agencies or
claims by the current owners of the former MGP sites); and
• $50 million related to remediation costs for decommissioning fossil fuel-fired generation facilities and sites.
110