PG&E 2011 Annual Report Download - page 16
Download and view the complete annual report
Please find page 16 of the 2011 PG&E annual report below. You can navigate through the pages in the report by either clicking on the pages listed below, or by using the keyword search tool below to find specific information within the annual report.-
 1
1 -
2
-
3
-
4
-
5
-
 6
6 -
 7
7 -
 8
8 -
 9
9 -
 10
10 -
 11
11 -
 12
12 -
 13
13 -
 14
14 -
 15
15 -
 16
16 -
 17
17 -
 18
18 -
 19
19 -
 20
20 -
 21
21 -
 22
22 -
 23
23 -
 24
24 -
 25
25 -
 26
26 -
27
-
28
-
29
-
30
-
31
-
32
-
33
-
34
-
35
-
36
-
37
-
38
-
39
-
40
-
41
-
42
-
43
-
44
-
45
-
46
-
47
-
48
-
49
-
50
-
51
-
52
-
53
-
54
-
55
-
56
-
57
-
58
-
59
-
60
-
61
-
62
-
63
-
64
-
65
-
66
-
67
-
68
-
69
-
70
-
71
-
72
-
73
-
74
-
75
-
76
-
77
-
78
-
79
-
80
-
81
-
82
-
83
-
84
-
85
-
86
-
87
-
88
-
89
-
90
-
91
-
92
-
93
-
94
-
95
-
96
-
97
-
98
-
99
-
100
-
101
-
102
-
103
-
104
-
105
-
106
-
107
-
108
-
109
-
110
-
111
-
112
-
113
-
114
-
115
-
116
-
117
-
118
-
119
-
120
-
121
-
122
-
123
-
124
-
125
-
126
-
127
-
128
 |
 |

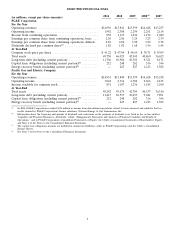
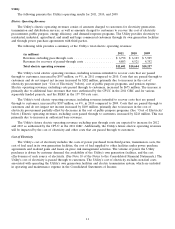
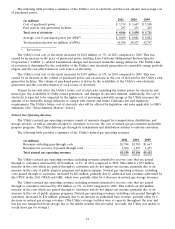
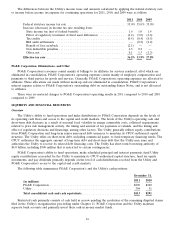
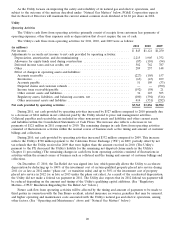
The following table provides a summary of the Utility’s cost of electricity and the total amount and average cost
of purchased power:
2011 2010 2009
(in millions)
Cost of purchased power ................................ $ 3,719 $ 3,647 $ 3,508
Fuel used in own generation facilities ....................... 297 251 203
Total cost of electricity .................................. $ 4,016 $ 3,898 $ 3,711
Average cost of purchased power per kWh(1) .................. $ 0.089 $ 0.081 $ 0.082
Total purchased power (in millions of kWh) .................. 41,958 44,837 42,767
(1) Kilowatt-hour
The Utility’s total cost of electricity increased by $118 million, or 3%, in 2011 compared to 2010. This was
caused by an increase in the price of purchased power resulting from California Independent System Operator
Corporation (‘‘CAISO’’)—related transmission charges and increased renewable energy deliveries. The Utility’s mix
of resources is determined by the availability of the Utility’s own electricity generation, its renewable energy portfolio
targets, and the cost-effectiveness of each source of electricity.
The Utility’s total cost of electricity increased by $187 million, or 5%, in 2010 compared to 2009. This was
caused by an increase in the volume of purchased power and an increase in the cost of fuel used in the Utility’s own
generation facilities. The volume of purchased power is driven by the availability of the Utility’s own electricity
generation and the cost-effectiveness of each source of electricity.
Various factors will affect the Utility’s future cost of electricity, including the market prices for electricity and
natural gas, the availability of Utility-owned generation, and changes in customer demand. Additionally, the cost of
electricity is expected to be impacted by the higher cost of procuring renewable energy as the Utility increases the
amount of its renewable energy deliveries to comply with current and future California law and regulatory
requirements. The Utility’s future cost of electricity also will be affected by legislation and rules applicable to GHG
emissions. (See ‘‘Environmental Matters’’ below.)
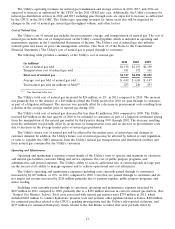
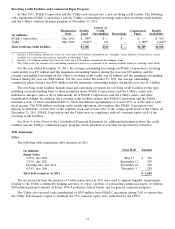
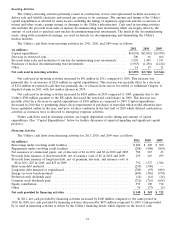
Natural Gas Operating Revenues
The Utility’s natural gas operating revenues consist of amounts charged for transportation, distribution, and
storage services, as well as amounts charged to customers to recover the cost of natural gas procurement and public
purpose programs. The Utility delivers gas through its transmission and distribution systems to end-use customers.
The following table provides a summary of the Utility’s natural gas operating revenues:
2011 2010 2009
(in millions)
Revenues excluding pass-through costs ......................... $1,784 $1,703 $1,667
Revenues for recovery of passed-through costs ................... 1,566 1,493 1,475
Total natural gas operating revenues .......................... $3,350 $3,196 $3,142
The Utility’s natural gas operating revenues, including revenues intended to recover costs that are passed
through to customers, increased by $154 million, or 5%, in 2011 compared to 2010. This reflects a $73 million
increase in the costs which are passed through to customers and do not impact net income, primarily due to an
increase in the costs of public purpose programs and pension expense. Natural gas operating revenues, excluding
costs passed through to customers, increased by $81 million, primarily due to additional base revenues authorized by
the CPUC in the 2011 GT&S and GRC, which were partially offset by a decrease in natural gas storage revenues.
The Utility’s natural gas operating revenues, including revenues intended to recover costs that are passed
through to customers, increased by $54 million, or 2%, in 2010 compared to 2009. This reflects an $18 million
increase in the costs which are passed through to customers and do not impact net income, primarily due to an
increase in the cost of public purpose programs. Natural gas operating revenues, excluding costs passed through to
customers, increased by $36 million, primarily due to an increase in authorized base revenue, partially offset by a
decrease in natural gas storage revenues. (The Utility’s storage facilities were at capacity throughout the year and
less gas was transported from storage due to the milder weather that prevailed. As result, the Utility was unable to
accept more gas for storage.)
12