PG&E 2011 Annual Report Download - page 41
Download and view the complete annual report
Please find page 41 of the 2011 PG&E annual report below. You can navigate through the pages in the report by either clicking on the pages listed below, or by using the keyword search tool below to find specific information within the annual report.-
 1
1 -
2
-
3
-
4
-
5
-
6
-
7
-
8
-
9
-
10
-
11
-
12
-
13
-
14
-
15
-
16
-
17
-
18
-
19
-
20
-
21
-
22
-
23
-
24
-
25
-
26
-
27
-
28
-
29
-
30
-
 31
31 -
 32
32 -
 33
33 -
 34
34 -
 35
35 -
 36
36 -
 37
37 -
 38
38 -
 39
39 -
 40
40 -
 41
41 -
 42
42 -
 43
43 -
 44
44 -
 45
45 -
 46
46 -
 47
47 -
 48
48 -
 49
49 -
 50
50 -
 51
51 -
52
-
53
-
54
-
55
-
56
-
57
-
58
-
59
-
60
-
61
-
62
-
63
-
64
-
65
-
66
-
67
-
68
-
69
-
70
-
71
-
72
-
73
-
74
-
75
-
76
-
77
-
78
-
79
-
80
-
81
-
82
-
83
-
84
-
85
-
86
-
87
-
88
-
89
-
90
-
91
-
92
-
93
-
94
-
95
-
96
-
97
-
98
-
99
-
100
-
101
-
102
-
103
-
104
-
105
-
106
-
107
-
108
-
109
-
110
-
111
-
112
-
113
-
114
-
115
-
116
-
117
-
118
-
119
-
120
-
121
-
122
-
123
-
124
-
125
-
126
-
127
-
128
 |
 |

PG&E Corporation and the Utility recognize the funded status of their respective plans on their respective
Consolidated Balance Sheets with an offsetting entry to accumulated other comprehensive income (loss), resulting in
no impact to their respective Consolidated Statements of Income.
Since 1993, the CPUC has authorized the Utility to recover the costs associated with its other postretirement
benefits based on the annual tax-deductible contributions to the appropriate trusts. Regulatory adjustments have
been recorded in the Consolidated Statements of Income and the Consolidated Balance Sheets of the Utility to
reflect the difference between Utility pension expense or income for accounting purposes and Utility pension expense
or income for ratemaking, which is based on a funding approach.
The differences between pension benefit costs recognized in accordance with GAAP and amounts recognized for
ratemaking purposes are recorded as a regulatory asset or liability as amounts are probable of recovery from
customers. Therefore, the difference is not expected to impact net income in future periods. (See Note 3 of the
Notes to the Consolidated Financial Statements.)
Pension and other postretirement benefit funds are held in external trusts. Trust assets, including accumulated
earnings, must be used exclusively for pension and other postretirement benefit payments. Consistent with the trusts’
investment policies, assets are primarily invested in equity securities and fixed-income securities. (See Note 12 of the
Notes to the Consolidated Financial Statements.)
PG&E Corporation and the Utility review recent cost trends and projected future trends in establishing health
care cost trend rates. This evaluation suggests that current rates of inflation are expected to continue in the near
term. In recognition of continued high inflation in health care costs and given the design of PG&E Corporation’s
plans, the assumed health care cost trend rate for 2011 is 8%, gradually decreasing to the ultimate trend rate of 5%
in 2018 and beyond.
Expected rates of return on plan assets were developed by determining projected stock and bond returns and
then applying these returns to the target asset allocations of the employee benefit trusts, resulting in a weighted
average rate of return on plan assets. Fixed-income returns were projected based on real maturity and credit spreads
added to a long-term inflation rate. Equity returns were estimated based on estimates of dividend yield and real
earnings growth added to a long-term rate of inflation. For the Utility’s defined benefit pension plan, the assumed
return of 5.5% compares to a ten-year actual return of 7.6%.
The rate used to discount pension benefits and other benefits was based on a yield curve developed from market
data of approximately 530 Aa-grade non-callable bonds at December 31, 2011. This yield curve has discount rates
that vary based on the duration of the obligations. The estimated future cash flows for the pension and other
postretirement benefit obligations were matched to the corresponding rates on the yield curve to derive a weighted
average discount rate.
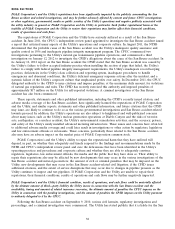
The following reflects the sensitivity of pension costs and projected benefit obligation to changes in certain
actuarial assumptions:
Increase Increase in 2011 Increase in Projected
(Decrease) in Pension Benefit Obligation at
Assumption Costs December 31, 2011
(in millions)
Discount rate ................... (0.5)% $91 $1,072
Rate of return on plan assets ........ (0.5)% 51 —
Rate of increase in compensation ..... 0.5% 41 253
The following reflects the sensitivity of other postretirement benefit costs and accumulated benefit obligation to
changes in certain actuarial assumptions:
Increase Increase in 2011 Increase in Accumulated
(Decrease) in Other Postretirement Benefit Obligation at
Assumption Benefit Costs December 31, 2011
(in millions)
Health care cost trend rate . . . 0.5% $4 $ 47
Discount rate ............. (0.5)% 1 117
Rate of return on plan assets . . (0.5)% 6 —
ACCOUNTING STANDARDS ISSUED BUT NOT YET ADOPTED
See Note 2 of the Notes to the Consolidated Financial Statements.
37