PG&E 2011 Annual Report Download - page 95
Download and view the complete annual report
Please find page 95 of the 2011 PG&E annual report below. You can navigate through the pages in the report by either clicking on the pages listed below, or by using the keyword search tool below to find specific information within the annual report.-
 1
1 -
2
-
3
-
4
-
5
-
6
-
7
-
8
-
9
-
10
-
11
-
12
-
13
-
14
-
15
-
16
-
17
-
18
-
19
-
20
-
21
-
22
-
23
-
24
-
25
-
26
-
27
-
28
-
29
-
30
-
31
-
32
-
33
-
34
-
35
-
36
-
37
-
38
-
39
-
40
-
41
-
42
-
43
-
44
-
45
-
46
-
47
-
48
-
49
-
50
-
51
-
52
-
53
-
54
-
55
-
56
-
57
-
58
-
59
-
60
-
61
-
62
-
63
-
64
-
65
-
66
-
67
-
68
-
69
-
70
-
71
-
72
-
73
-
74
-
75
-
76
-
77
-
78
-
79
-
80
-
81
-
82
-
83
-
84
-
 85
85 -
 86
86 -
 87
87 -
 88
88 -
 89
89 -
 90
90 -
 91
91 -
 92
92 -
 93
93 -
 94
94 -
 95
95 -
 96
96 -
 97
97 -
 98
98 -
 99
99 -
 100
100 -
 101
101 -
 102
102 -
 103
103 -
 104
104 -
 105
105 -
106
-
107
-
108
-
109
-
110
-
111
-
112
-
113
-
114
-
115
-
116
-
117
-
118
-
119
-
120
-
121
-
122
-
123
-
124
-
125
-
126
-
127
-
128
 |
 |

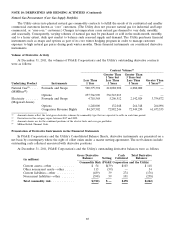
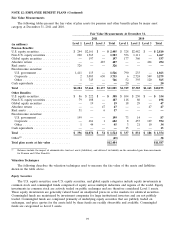
NOTE 11: FAIR VALUE MEASUREMENTS (Continued)
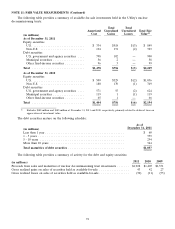
The following table provides a summary of available-for-sale investments held in the Utility’s nuclear
decommissioning trusts:
Total Total
Amortized Unrealized Unrealized Total Fair
Cost Gains Losses Value(1)
(in millions)
As of December 31, 2011
Equity securities
U.S. ............................. $ 334 $518 $ (3) $ 849
Non-U.S. ......................... 194 131 (2) 323
Debt securities
U.S. government and agency securities .... 798 102 — 900
Municipal securities .................. 56 2 — 58
Other fixed-income securities ........... 96 3 — 99
Total .............................. $1,478 $756 $ (5) $2,229
As of December 31, 2010
Equity securities
U.S. ............................. $ 509 $529 $ (2) $1,036
Non-U.S. ......................... 180 170 (1) 349
Debt securities
U.S. government and agency securities .... 571 55 (2) 624
Municipal securities .................. 119 1 (1) 119
Other fixed-income securities ........... 65 1 — 66
Total .............................. $1,444 $756 $ (6) $2,194
(1) Excludes $188 million and $185 million at December 31, 2011 and 2010, respectively, primarily related to deferred taxes on
appreciation of investment value.
The debt securities mature on the following schedule:
As of
December 31, 2011
(in millions)
Less than 1 year ............................................. $ 60
1 - 5 years ................................................. 359
5 - 10 years ................................................ 294
More than 10 years .......................................... 344
Total maturities of debt securities ................................ $1,057
The following table provides a summary of activity for the debt and equity securities:
2011 2010 2009
(in millions)
Proceeds from sales and maturities of nuclear decommissioning trust investments ....... $1,928 $1,405 $1,351
Gross realized gains on sales of securities held as available-for-sale ................. 43 42 27
Gross realized losses on sales of securities held as available-for-sale ................. (30) (11) (55)
91