PG&E 2011 Annual Report Download - page 101
Download and view the complete annual report
Please find page 101 of the 2011 PG&E annual report below. You can navigate through the pages in the report by either clicking on the pages listed below, or by using the keyword search tool below to find specific information within the annual report.-
 1
1 -
2
-
3
-
4
-
5
-
6
-
7
-
8
-
9
-
10
-
11
-
12
-
13
-
14
-
15
-
16
-
17
-
18
-
19
-
20
-
21
-
22
-
23
-
24
-
25
-
26
-
27
-
28
-
29
-
30
-
31
-
32
-
33
-
34
-
35
-
36
-
37
-
38
-
39
-
40
-
41
-
42
-
43
-
44
-
45
-
46
-
47
-
48
-
49
-
50
-
51
-
52
-
53
-
54
-
55
-
56
-
57
-
58
-
59
-
60
-
61
-
62
-
63
-
64
-
65
-
66
-
67
-
68
-
69
-
70
-
71
-
72
-
73
-
74
-
75
-
76
-
77
-
78
-
79
-
80
-
81
-
82
-
83
-
84
-
85
-
86
-
87
-
88
-
89
-
90
-
 91
91 -
 92
92 -
 93
93 -
 94
94 -
 95
95 -
 96
96 -
 97
97 -
 98
98 -
 99
99 -
 100
100 -
 101
101 -
 102
102 -
 103
103 -
 104
104 -
 105
105 -
 106
106 -
 107
107 -
 108
108 -
 109
109 -
 110
110 -
 111
111 -
112
-
113
-
114
-
115
-
116
-
117
-
118
-
119
-
120
-
121
-
122
-
123
-
124
-
125
-
126
-
127
-
128
 |
 |

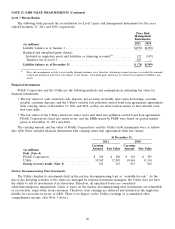
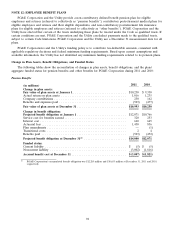
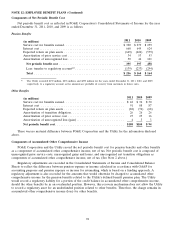
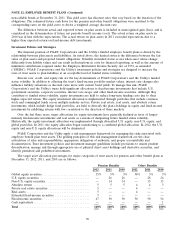
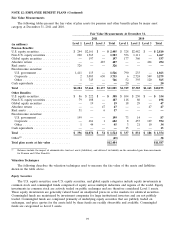
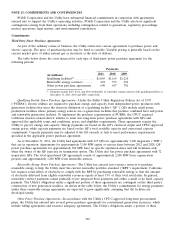
NOTE 12: EMPLOYEE BENEFIT PLANS (Continued)
Fair Value Measurements
The following tables present the fair value of plan assets for pension and other benefits plans by major asset
category at December 31, 2011 and 2010.
Fair Value Measurements At December 31,
2011 2010
Level 1 Level 2 Level 3 Total Level 1 Level 2 Level 3 Total
(in millions)
Pension Benefits:
U.S. equity securities .................. $ 244 $2,161 $ — $ 2,405 $ 328 $2,482 $ — $ 2,810
Non-U.S. equity securities .............. 220 1,363 — 1,583 356 1,111 — 1,467
Global equity securities ................ — 197 — 197 177 360 — 537
Absolute return ..................... ——487 487 ——494 494
Real assets ......................... 326 ——326 ————
Fixed-income securities:
U.S. government ................... 1,411 115 — 1,526 790 233 — 1,023
Corporate ........................ 2 3,083 650 3,735 6 2,724 549 3,279
Other ........................... 1 745 —746 52 393 120 565
Cash equivalents ..................... ————20 ——20
Total ............................. $2,204 $7,664 $1,137 $11,005 $1,729 $7,303 $1,163 $10,195
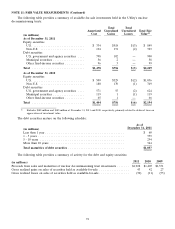
Other Benefits:
U.S. equity securities .................. $ 86 $ 222 $ —$ 308 $ 104 $ 230 $ — $ 334
Non-U.S. equity securities .............. 79 108 —187 118 80 — 198
Global equity securities ................ — 19 — 19 18 29 — 47
Absolute return ..................... ——47 47 ——47 47
Real assets ......................... 31 — 6 37 ————
Fixed-income securities:
U.S. government ................... 199 ——199 73 14 — 87
Corporate ........................ — 681 1 682 8 457 129 594
Other ........................... 1 44 —45 3211034
Cash equivalents ..................... ————13 ——13
Total ............................. $ 396 $1,074 $ 54 $ 1,524 $ 337 $ 831 $ 186 $ 1,354
Other(1) ........................... (45) 38
Total plan assets at fair value ........... $12,484 $11,587
(1) Balances include the impact of administrative trust net assets (liabilities), and deferred tax liability on the unrealized gain from investments
for Pension and Other Benefits.
Valuation Techniques
The following describes the valuation techniques used to measure the fair value of the assets and liabilities
shown in the table above.
Equity Securities
The U.S. equity securities, non-U.S. equity securities, and global equity categories include equity investments in
common stock and commingled funds comprised of equity across multiple industries and regions of the world. Equity
investments in common stock are actively traded on public exchanges and are therefore considered Level 1 assets.
These equity investments are generally valued based on unadjusted prices in active markets for identical securities.
Commingled funds are maintained by investment companies for large institutional investors and are not publicly
traded. Commingled funds are comprised primarily of underlying equity securities that are publicly traded on
exchanges, and price quotes for the assets held by these funds are readily observable and available. Commingled
funds are categorized as Level 2 assets.
97