PG&E 2011 Annual Report Download - page 65
Download and view the complete annual report
Please find page 65 of the 2011 PG&E annual report below. You can navigate through the pages in the report by either clicking on the pages listed below, or by using the keyword search tool below to find specific information within the annual report.-
 1
1 -
2
-
3
-
4
-
5
-
6
-
7
-
8
-
9
-
10
-
11
-
12
-
13
-
14
-
15
-
16
-
17
-
18
-
19
-
20
-
21
-
22
-
23
-
24
-
25
-
26
-
27
-
28
-
29
-
30
-
31
-
32
-
33
-
34
-
35
-
36
-
37
-
38
-
39
-
40
-
41
-
42
-
43
-
44
-
45
-
46
-
47
-
48
-
49
-
50
-
51
-
52
-
53
-
54
-
 55
55 -
 56
56 -
 57
57 -
 58
58 -
 59
59 -
 60
60 -
 61
61 -
 62
62 -
 63
63 -
 64
64 -
 65
65 -
 66
66 -
 67
67 -
 68
68 -
 69
69 -
 70
70 -
 71
71 -
 72
72 -
 73
73 -
 74
74 -
 75
75 -
76
-
77
-
78
-
79
-
80
-
81
-
82
-
83
-
84
-
85
-
86
-
87
-
88
-
89
-
90
-
91
-
92
-
93
-
94
-
95
-
96
-
97
-
98
-
99
-
100
-
101
-
102
-
103
-
104
-
105
-
106
-
107
-
108
-
109
-
110
-
111
-
112
-
113
-
114
-
115
-
116
-
117
-
118
-
119
-
120
-
121
-
122
-
123
-
124
-
125
-
126
-
127
-
128
 |
 |

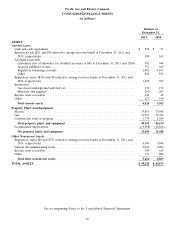
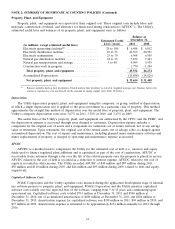
NOTE 2: SUMMARY OF SIGNIFICANT ACCOUNTING POLICIES (Continued)
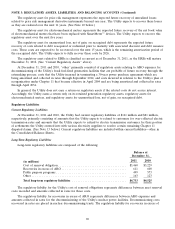
Property, Plant, and Equipment
Property, plant, and equipment are reported at their original cost. These original costs include labor and
materials, construction overhead, and allowance for funds used during construction (‘‘AFUDC’’). The Utility’s
estimated useful lives and balances of its property, plant, and equipment were as follows:
Balance at
December 31,
Estimated Useful
Lives (years) 2011 2010
(in millions, except estimated useful lives)
Electricity generating facilities(1) .................. 20 to 100 $ 6,488 $ 6,012
Electricity distribution facilities ................... 10 to 55 22,395 20,991
Electricity transmission ......................... 25 to 70 6,968 6,505
Natural gas distribution facilities .................. 24 to 53 7,832 7,443
Natural gas transportation and storage .............. 5 to 48 4,099 3,939
Construction work in progress .................... 1,770 1,384
Total property, plant, and equipment ............. 49,552 46,274
Accumulated Depreciation ...................... (15,898) (14,826)
Net property, plant, and equipment .............. $ 33,654 $ 31,448
(1) Balance includes nuclear fuel inventories. Stored nuclear fuel inventory is stated at weighted average cost. Nuclear fuel in the
reactor is expensed as it is used based on the amount of energy output. (See Note 15 below.)
Depreciation
The Utility depreciates property, plant, and equipment using the composite, or group, method of depreciation,
in which a single depreciation rate is applied to the gross investment in a particular class of property. This method
approximates the straight line method of depreciation over the useful lives of property, plant, and equipment. The
Utility’s composite depreciation rates were 3.67% in 2011, 3.38% in 2010, and 3.43% in 2009.
The useful lives of the Utility’s property, plant, and equipment are authorized by the CPUC and the FERC, and
the depreciation expense is recovered through rates charged to customers. Depreciation expense includes a
component for the original cost of assets and a component for estimated cost of future removal, net of any salvage
value at retirement. Upon retirement, the original cost of the retired assets, net of salvage value, is charged against
accumulated depreciation. The cost of repairs and maintenance, including planned major maintenance activities and
minor replacements of property, is charged to operating and maintenance expense as incurred.
AFUDC
AFUDC is a method used to compensate the Utility for the estimated cost of debt (i.e., interest) and equity
funds used to finance regulated plant additions and is capitalized as part of the cost of construction. AFUDC is
recoverable from customers through rates over the life of the related property once the property is placed in service.
AFUDC related to the cost of debt is recorded as a reduction to interest expense. AFUDC related to the cost of
equity is recorded in other income. The Utility recorded AFUDC of $40 million and $87 million during 2011,
$50 million and $110 million during 2010, and $44 million and $95 million during 2009, related to debt and equity,
respectively.
Capitalized Software Costs
PG&E Corporation and the Utility capitalize costs incurred during the application development stage of internal
use software projects to property, plant, and equipment. PG&E Corporation and the Utility amortize capitalized
software costs ratably over the expected lives of the software, ranging from 5 to 15 years and commencing upon
operational use. Capitalized software costs totaled $714 million at December 31, 2011 and $580 million at
December 31, 2010, net of accumulated amortization of $480 million at December 31, 2011 and $386 million at
December 31, 2010. Amortization expense for capitalized software was $138 million in 2011, $94 million in 2010, and
$37 million in 2009. Amortization expense is estimated to be approximately $154 million annually for 2012 through
2016.
61