PG&E 2011 Annual Report Download - page 85
Download and view the complete annual report
Please find page 85 of the 2011 PG&E annual report below. You can navigate through the pages in the report by either clicking on the pages listed below, or by using the keyword search tool below to find specific information within the annual report.-
 1
1 -
2
-
3
-
4
-
5
-
6
-
7
-
8
-
9
-
10
-
11
-
12
-
13
-
14
-
15
-
16
-
17
-
18
-
19
-
20
-
21
-
22
-
23
-
24
-
25
-
26
-
27
-
28
-
29
-
30
-
31
-
32
-
33
-
34
-
35
-
36
-
37
-
38
-
39
-
40
-
41
-
42
-
43
-
44
-
45
-
46
-
47
-
48
-
49
-
50
-
51
-
52
-
53
-
54
-
55
-
56
-
57
-
58
-
59
-
60
-
61
-
62
-
63
-
64
-
65
-
66
-
67
-
68
-
69
-
70
-
71
-
72
-
73
-
74
-
 75
75 -
 76
76 -
 77
77 -
 78
78 -
 79
79 -
 80
80 -
 81
81 -
 82
82 -
 83
83 -
 84
84 -
 85
85 -
 86
86 -
 87
87 -
 88
88 -
 89
89 -
 90
90 -
 91
91 -
 92
92 -
 93
93 -
 94
94 -
 95
95 -
96
-
97
-
98
-
99
-
100
-
101
-
102
-
103
-
104
-
105
-
106
-
107
-
108
-
109
-
110
-
111
-
112
-
113
-
114
-
115
-
116
-
117
-
118
-
119
-
120
-
121
-
122
-
123
-
124
-
125
-
126
-
127
-
128
 |
 |

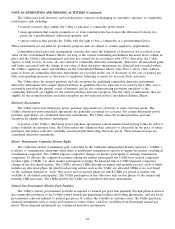
NOTE 9: INCOME TAXES
The significant components of income tax provision (benefit) were as follows:
PG&E Corporation Utility
Year Ended December 31,
2011 2010 2009 2011 2010 2009
(in millions)
Current:
Federal ........................................... $ (77) $(12) $(747) $ (83) $(54) $ (696)
State ............................................. 152 130 (41) 161 134 (45)
Deferred:
Federal ........................................... 504 525 1,161 534 589 1,139
State ............................................. (135) (91) 92 (128) (90) 89
Tax credits .......................................... (4) (5) (5) (4) (5) (5)
Income tax provision ................................. $ 440 $547 $ 460 $ 480 $574 $ 482
The following describes net deferred income tax liabilities:
PG&E
Corporation Utility
Year Ended December 31,
2011 2010 2011 2010
(in millions)
Deferred income tax assets:
Customer advances for construction ................................. $ 108 $ — $ 108 $ —
Reserve for damages ............................................ 243 222 243 222
Environmental reserve ........................................... 157 242 157 242
Compensation ................................................. 310 345 258 305
Net operating loss carry forward .................................... 728 327 567 270
Other ....................................................... 217 207 180 178
Total deferred income tax assets .................................. $1,763 $1,343 $1,513 $1,217
Deferred income tax liabilities:
Regulatory balancing accounts ..................................... $ 878 $1,116 $ 878 $1,116
Property related basis differences ................................... 6,309 5,236 6,301 5,234
Income tax regulatory asset ....................................... 588 509 588 509
Other ....................................................... 192 142 105 135
Total deferred income tax liabilities ................................ $7,967 $7,003 $7,872 $6,994
Total net deferred income tax liabilities ............................. $6,204 $5,660 $6,359 $5,777
Classification of net deferred income tax liabilities:
Included in current liabilities ...................................... $ 196 $ 113 $ 199 $ 118
Included in noncurrent liabilities .................................... 6,008 5,547 6,160 5,659
Total net deferred income tax liabilities ............................. $6,204 $5,660 $6,359 $5,777
81