OfficeMax 2014 Annual Report Download - page 83
Download and view the complete annual report
Please find page 83 of the 2014 OfficeMax annual report below. You can navigate through the pages in the report by either clicking on the pages listed below, or by using the keyword search tool below to find specific information within the annual report.-
 1
1 -
2
-
3
-
4
-
5
-
6
-
7
-
8
-
9
-
10
-
11
-
12
-
13
-
14
-
15
-
16
-
17
-
18
-
19
-
20
-
21
-
22
-
23
-
24
-
25
-
26
-
27
-
28
-
29
-
30
-
31
-
32
-
33
-
34
-
35
-
36
-
37
-
38
-
39
-
40
-
41
-
42
-
43
-
44
-
45
-
46
-
47
-
48
-
49
-
50
-
51
-
52
-
53
-
54
-
55
-
56
-
57
-
58
-
59
-
60
-
61
-
62
-
63
-
64
-
65
-
66
-
67
-
68
-
69
-
70
-
71
-
72
-
 73
73 -
 74
74 -
 75
75 -
 76
76 -
 77
77 -
 78
78 -
 79
79 -
 80
80 -
 81
81 -
 82
82 -
 83
83 -
 84
84 -
 85
85 -
 86
86 -
 87
87 -
 88
88 -
 89
89 -
 90
90 -
 91
91 -
 92
92 -
 93
93 -
94
-
95
-
96
-
97
-
98
-
99
-
100
-
101
-
102
-
103
-
104
-
105
-
106
-
107
-
108
-
109
-
110
-
111
-
112
-
113
-
114
-
115
-
116
-
117
-
118
-
119
-
120
-
121
-
122
-
123
-
124
-
125
-
126
-
127
-
128
-
129
-
130
-
131
-
132
-
133
-
134
-
135
-
136
-
137
-
138
-
139
-
140
-
141
-
142
-
143
-
144
-
145
-
146
-
147
-
148
-
149
-
150
-
151
-
152
-
153
-
154
-
155
-
156
-
157
-
158
-
159
-
160
-
161
-
162
-
163
-
164
-
165
-
166
-
167
-
168
-
169
-
170
-
171
-
172
-
173
-
174
-
175
-
176
-
177
 |
 |
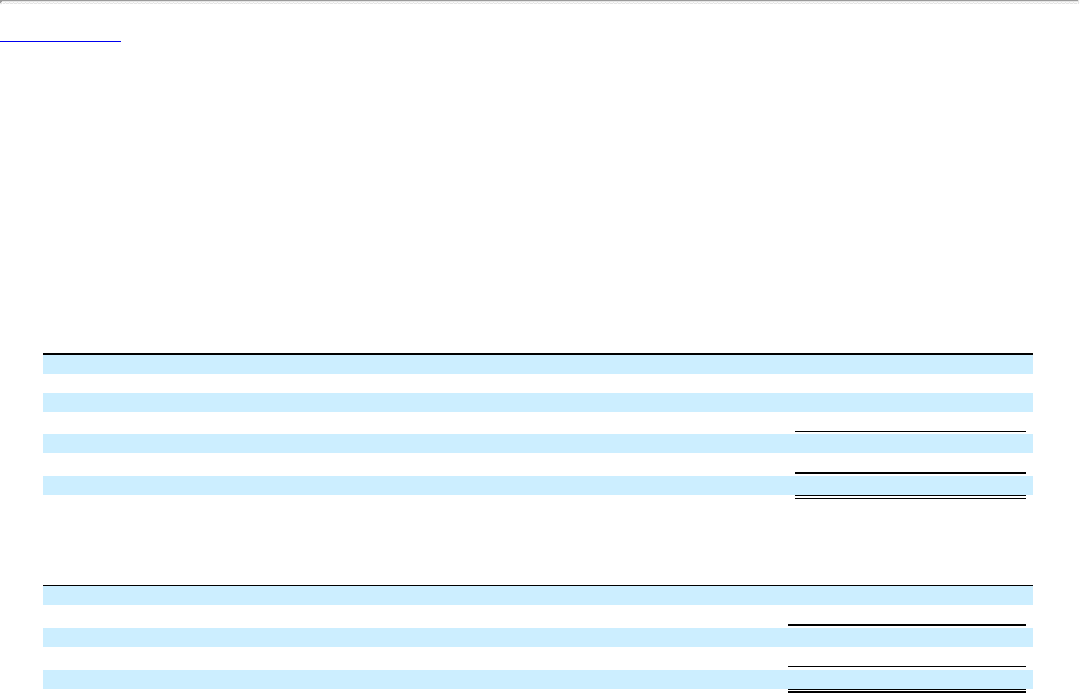
Table of Contents
The remaining $137 million and $103 million in 2014 and 2013, respectively, are excluded from the table above because these items are expensed as
incurred, non-cash, or otherwise not associated with the merger and restructuring balance sheet accounts. The $137 million incurred in 2014 is comprised of
$124 million merger transaction and integration expenses, $9 million European restructuring transaction and integration expenses, $5 million employee non-
cash equity compensation expenses, and $1 million net credit associated primarily to fixed assets and rent related items. The $103 million incurred in 2013 is
comprised of $80 million merger transaction and integration expenses, $20 million employee non-cash equity compensation expenses, and a net $3 million
of other expenses.
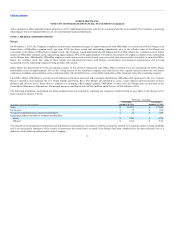
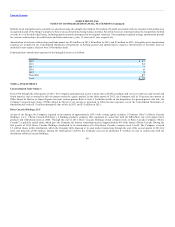
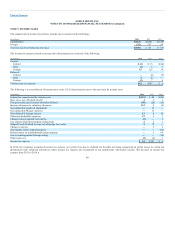
Property and equipment consists of:
(In millions)
December 28,
2013
Land $ 88 $ 101
Buildings 431 469
Leasehold improvements 745 780
Furniture, fixtures and equipment 1,480 1,605
2,744 2,955
Less accumulated depreciation (1,781) (1,646)
Total $ 963 $ 1,309
The above table of property and equipment includes assets held under capital leases as follows:
(In thousands)
December 28,
2013
Buildings $ 204 $ 228
Furniture, fixtures and equipment 74 65
278 293
Less accumulated depreciation (124) (127)
Total $ 154 $ 166
Depreciation expense was $210 million in 2014, $149 million in 2013, and $152 million in 2012.
Included in furniture, fixtures and equipment above are capitalized software costs of $558 million and $531 million at December 27, 2014 and December 28,
2013, respectively. The unamortized amounts of the capitalized software costs are $148 million and $236 million at December 27, 2014 and December 28,
2013, respectively. Amortization of capitalized software costs totaled $86 million, $56 million and $46 million in 2014, 2013 and 2012, respectively.
Software development costs that do not meet the criteria for capitalization are expensed as incurred.
81