OfficeMax 2014 Annual Report Download - page 71
Download and view the complete annual report
Please find page 71 of the 2014 OfficeMax annual report below. You can navigate through the pages in the report by either clicking on the pages listed below, or by using the keyword search tool below to find specific information within the annual report.-
 1
1 -
2
-
3
-
4
-
5
-
6
-
7
-
8
-
9
-
10
-
11
-
12
-
13
-
14
-
15
-
16
-
17
-
18
-
19
-
20
-
21
-
22
-
23
-
24
-
25
-
26
-
27
-
28
-
29
-
30
-
31
-
32
-
33
-
34
-
35
-
36
-
37
-
38
-
39
-
40
-
41
-
42
-
43
-
44
-
45
-
46
-
47
-
48
-
49
-
50
-
51
-
52
-
53
-
54
-
55
-
56
-
57
-
58
-
59
-
60
-
 61
61 -
 62
62 -
 63
63 -
 64
64 -
 65
65 -
 66
66 -
 67
67 -
 68
68 -
 69
69 -
 70
70 -
 71
71 -
 72
72 -
 73
73 -
 74
74 -
 75
75 -
 76
76 -
 77
77 -
 78
78 -
 79
79 -
 80
80 -
 81
81 -
82
-
83
-
84
-
85
-
86
-
87
-
88
-
89
-
90
-
91
-
92
-
93
-
94
-
95
-
96
-
97
-
98
-
99
-
100
-
101
-
102
-
103
-
104
-
105
-
106
-
107
-
108
-
109
-
110
-
111
-
112
-
113
-
114
-
115
-
116
-
117
-
118
-
119
-
120
-
121
-
122
-
123
-
124
-
125
-
126
-
127
-
128
-
129
-
130
-
131
-
132
-
133
-
134
-
135
-
136
-
137
-
138
-
139
-
140
-
141
-
142
-
143
-
144
-
145
-
146
-
147
-
148
-
149
-
150
-
151
-
152
-
153
-
154
-
155
-
156
-
157
-
158
-
159
-
160
-
161
-
162
-
163
-
164
-
165
-
166
-
167
-
168
-
169
-
170
-
171
-
172
-
173
-
174
-
175
-
176
-
177
 |
 |

Table of Contents
Other receivables are $452 million and $478 million at December 27, 2014 and December 28, 2013, respectively, of which $360 million and $319 million,
respectively, are amounts due from vendors under purchase rebate, cooperative advertising and various other marketing programs.
The Company sells selected accounts receivables on a non-recourse basis to an unrelated financial institution under a factoring agreement in France. The
Company accounts for this transaction as a sale of receivables, removes receivables sold from its financial statements, and records cash proceeds when
received by the Company as cash provided by operating activities in the Consolidated Statements of Cash Flows. The financial institution makes available
80% of the face value of the receivables to the Company and retains the remaining 20% as a guarantee until the receipt of the proceeds associated with the
factored invoices.
In 2014 and 2013, the Company withdrew $479 million and $443 million, respectively, under the factoring agreement. Receivables sold for which the
Company did not obtain cash directly from the financial institution are included in Receivables and amount to $6 million and $10 million as of
December 27, 2014 and December 28, 2013, respectively. Retention guarantees of $11 million and $13 million are included in Prepaid expenses and other
current assets in the Consolidated Balance Sheets as of December 27, 2014 and December 28, 2013, respectively.
: Inventories are stated at the lower of cost or market value and are reduced for inventory losses based on estimated obsolescence and the results
of physical counts. In-bound freight is included as a cost of inventories. Also, cash discounts and certain vendor allowances that are related to inventory
purchases are recorded as a product cost reduction. The weighted average method is used throughout the Company to determine the cost of inventory and the
first-in-first-out method is used for inventory held within certain European countries where the Company has operations.
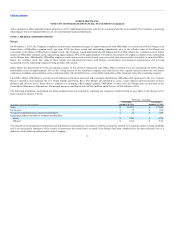
At December 27, 2014 and December 28, 2013, Prepaid expenses and other current assets on the Consolidated
Balance Sheets included prepaid expenses of $116 million and $163 million, respectively, relating to short-term advance payments on rent, marketing,
services and other matters. Also, refer to Note 9 for information on deferred taxes included in this financial statement caption.
: Income taxes are accounted for under the asset and liability method. This approach requires the recognition of deferred tax assets and
liabilities attributable to differences between the carrying amounts and the tax bases of assets and liabilities and operating loss and tax credit carryforwards.
Valuation allowances are recorded to reduce deferred tax assets to the amount believed to be more likely than not to be realized. The Company recognizes
tax benefits from uncertain tax positions when it is more likely than not that the position will be sustained upon examination. Interest related to income tax
exposures is included in interest expense in the Consolidated Statements of Operations. Refer to Note 9 for additional information on income taxes.
: Property and equipment additions are recorded at cost. Depreciation and amortization is recognized over the estimated useful
lives using the straight-line method. The useful lives of depreciable assets are estimated to be 15-30 years for buildings and 3-10 years for furniture, fixtures
and equipment. Computer software is amortized over three years for common office applications, five years for larger business applications and seven years
for certain enterprise-wide systems. Leasehold improvements are amortized over the shorter of the estimated economic lives of the improvements or the terms
of the underlying leases, including renewal options considered reasonably assured. The Company capitalizes certain costs related to internal use software that
is expected to benefit future periods. These costs are amortized using the straight-line method over the 3–7 year expected life of the software. Major repairs
that extend the useful lives of assets are capitalized and amortized over the estimated use period. Routine maintenance costs are expensed as incurred.
69