OfficeMax 2014 Annual Report Download - page 123
Download and view the complete annual report
Please find page 123 of the 2014 OfficeMax annual report below. You can navigate through the pages in the report by either clicking on the pages listed below, or by using the keyword search tool below to find specific information within the annual report.-
 1
1 -
2
-
3
-
4
-
5
-
6
-
7
-
8
-
9
-
10
-
11
-
12
-
13
-
14
-
15
-
16
-
17
-
18
-
19
-
20
-
21
-
22
-
23
-
24
-
25
-
26
-
27
-
28
-
29
-
30
-
31
-
32
-
33
-
34
-
35
-
36
-
37
-
38
-
39
-
40
-
41
-
42
-
43
-
44
-
45
-
46
-
47
-
48
-
49
-
50
-
51
-
52
-
53
-
54
-
55
-
56
-
57
-
58
-
59
-
60
-
61
-
62
-
63
-
64
-
65
-
66
-
67
-
68
-
69
-
70
-
71
-
72
-
73
-
74
-
75
-
76
-
77
-
78
-
79
-
80
-
81
-
82
-
83
-
84
-
85
-
86
-
87
-
88
-
89
-
90
-
91
-
92
-
93
-
94
-
95
-
96
-
97
-
98
-
99
-
100
-
101
-
102
-
103
-
104
-
105
-
106
-
107
-
108
-
109
-
110
-
111
-
112
-
 113
113 -
 114
114 -
 115
115 -
 116
116 -
 117
117 -
 118
118 -
 119
119 -
 120
120 -
 121
121 -
 122
122 -
 123
123 -
 124
124 -
 125
125 -
 126
126 -
 127
127 -
 128
128 -
 129
129 -
 130
130 -
 131
131 -
 132
132 -
 133
133 -
134
-
135
-
136
-
137
-
138
-
139
-
140
-
141
-
142
-
143
-
144
-
145
-
146
-
147
-
148
-
149
-
150
-
151
-
152
-
153
-
154
-
155
-
156
-
157
-
158
-
159
-
160
-
161
-
162
-
163
-
164
-
165
-
166
-
167
-
168
-
169
-
170
-
171
-
172
-
173
-
174
-
175
-
176
-
177
 |
 |

Table of Contents
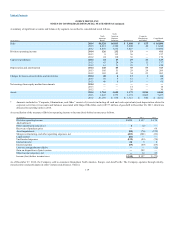
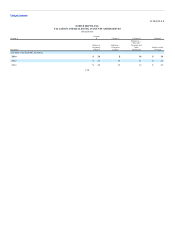
(In millions, except per share amounts) First Quarter Second Quarter Third Quarter Fourth Quarter
Fiscal Year Ended December 28, 2013*
Net sales $ 2,718 $ 2,419 $ 2,619 $ 3,486
Gross profit 660 546 633 787
Net income (loss) (7) (54) 161 (121)
Net income (loss) attributable to Office Depot, Inc. (7) (54) 161 (121)
Net income (loss) available to common stockholders (17) (64) 133 (144)
Net earnings (loss) per share:
Basic $ (0.06) $ (0.23) $ 0.42 $ (0.34)
Diluted $ (0.06) $ (0.23) $ 0.41 $ (0.34)
* Due to rounding, the sum of the quarterly earnings amounts may not equal the reported amounts for the year.
In the first, second, third and fourth quarters of 2013, captions include pre-tax Merger, restructuring, and other operating expenses amounting to $19
million, $26 million, $44 million and $111 million, respectively and asset impairments of $5 million, $4 million, $49 million and $12 million,
respectively.
Net income available to common stockholders includes an after-tax gain of approximately $235 million resulting from the sale of Office Depot de
Mexico and preferred stock dividends of $22 million associated to redemption in July 2013.
Net income available to common stockholders includes (i) impact of the Merger of $939 million in Sales and $(39) million in Net income (loss); and
(ii) preferred stock dividends of $23 million associated to redemption in November 2013.
121
(2) (3)
(1)
(1)
(1)
(1)
(2)
(3)