OfficeMax 2014 Annual Report Download - page 29
Download and view the complete annual report
Please find page 29 of the 2014 OfficeMax annual report below. You can navigate through the pages in the report by either clicking on the pages listed below, or by using the keyword search tool below to find specific information within the annual report.-
 1
1 -
2
-
3
-
4
-
5
-
6
-
7
-
8
-
9
-
10
-
11
-
12
-
13
-
14
-
15
-
16
-
17
-
18
-
 19
19 -
 20
20 -
 21
21 -
 22
22 -
 23
23 -
 24
24 -
 25
25 -
 26
26 -
 27
27 -
 28
28 -
 29
29 -
 30
30 -
 31
31 -
 32
32 -
 33
33 -
 34
34 -
 35
35 -
 36
36 -
 37
37 -
 38
38 -
 39
39 -
40
-
41
-
42
-
43
-
44
-
45
-
46
-
47
-
48
-
49
-
50
-
51
-
52
-
53
-
54
-
55
-
56
-
57
-
58
-
59
-
60
-
61
-
62
-
63
-
64
-
65
-
66
-
67
-
68
-
69
-
70
-
71
-
72
-
73
-
74
-
75
-
76
-
77
-
78
-
79
-
80
-
81
-
82
-
83
-
84
-
85
-
86
-
87
-
88
-
89
-
90
-
91
-
92
-
93
-
94
-
95
-
96
-
97
-
98
-
99
-
100
-
101
-
102
-
103
-
104
-
105
-
106
-
107
-
108
-
109
-
110
-
111
-
112
-
113
-
114
-
115
-
116
-
117
-
118
-
119
-
120
-
121
-
122
-
123
-
124
-
125
-
126
-
127
-
128
-
129
-
130
-
131
-
132
-
133
-
134
-
135
-
136
-
137
-
138
-
139
-
140
-
141
-
142
-
143
-
144
-
145
-
146
-
147
-
148
-
149
-
150
-
151
-
152
-
153
-
154
-
155
-
156
-
157
-
158
-
159
-
160
-
161
-
162
-
163
-
164
-
165
-
166
-
167
-
168
-
169
-
170
-
171
-
172
-
173
-
174
-
175
-
176
-
177
 |
 |

Table of Contents
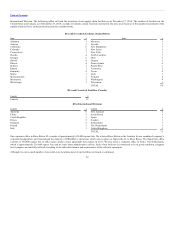
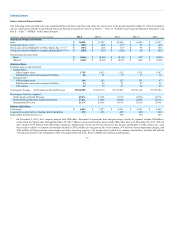
The following table sets forth selected consolidated financial data at and for each of the five fiscal years in the period ended December 27, 2014. It should be
read in conjunction with the Consolidated Financial Statements and Notes thereto in Part IV — Item 15. “Exhibits and Financial Statement Schedules” and
Part II — Item 7. “MD&A” of this Annual Report.
(In millions, except per share amounts and statistical data) 2013 2012 2011 2010
Sales $ 11,242 $ 10,696 $ 11,489 $ 11,633
Net income (loss) $ (20) $ (77) $ 96 $ (46)
Net income (loss) attributable to Office Depot, Inc. $ (20) $ (77) $ 96 $ (45)
Net income (loss) available to common shareholders $ (93) $ (110) $ 60 $ (82)
Net earnings (loss) per share:
Basic $ (0.29) $ (0.39) $ 0.22 $ (0.30)
Diluted $ (0.29) $ (0.39) $ 0.22 $ (0.30)
Facilities open at end of period:
United States:
Office supply stores 1,912 1,112 1,131 1,147
Distribution centers and crossdock facilities 81 15 15 16
International :
Office supply stores 163 123 131 97
Distribution centers and crossdock facilities 46 23 27 26
Call centers 19 21 22 25
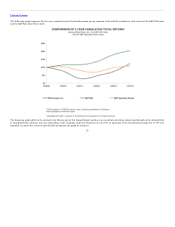
Total square footage — North American Retail Division 43,642,514 25,518,027 26,556,126 27,559,184
Percentage of sales by segment:
North American Retail Division 41.0% 41.7% 42.4% 42.7%
North American Business Solutions Division 31.8% 30.0% 28.4% 28.3%
International Division 26.8% 28.3% 29.2% 29.0%
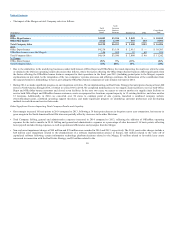
Total assets $ 7,477 $ 4,011 $ 4,251 $ 4,569
Long-term recourse debt, excluding current maturities 696 485 648 660
Redeemable preferred stock, net — 386 364 356
On November 5, 2013, the Company merged with OfficeMax. Statement of operations data and percentage of sales by segment include OfficeMax’s
results from the Merger date through December 28, 2013. Balance sheet and facilities data include OfficeMax data as of December 28, 2013. Sales in
2013 include $939 million from OfficeMax operations. Additionally, fiscal year Net income (loss), Net income attributable to Office Depot, Inc., and
Net income available to common shareholders includes a $382 million pre-tax gain on sale of investment, $70 million of asset impairment charges, and
$201 million of Merger-related, restructuring, and other operating expenses. Net income (loss) available to common shareholders includes $45 million
of dividends related to the redemption of the redeemable preferred stock. Refer to MD&A for additional information.
27
(1) (2)
(3)(4)(5)(6)
(3)(4)(5)(6)
(3)(4)(5)(6)
(7)
(1)