OfficeMax 2014 Annual Report Download - page 122
Download and view the complete annual report
Please find page 122 of the 2014 OfficeMax annual report below. You can navigate through the pages in the report by either clicking on the pages listed below, or by using the keyword search tool below to find specific information within the annual report.-
 1
1 -
2
-
3
-
4
-
5
-
6
-
7
-
8
-
9
-
10
-
11
-
12
-
13
-
14
-
15
-
16
-
17
-
18
-
19
-
20
-
21
-
22
-
23
-
24
-
25
-
26
-
27
-
28
-
29
-
30
-
31
-
32
-
33
-
34
-
35
-
36
-
37
-
38
-
39
-
40
-
41
-
42
-
43
-
44
-
45
-
46
-
47
-
48
-
49
-
50
-
51
-
52
-
53
-
54
-
55
-
56
-
57
-
58
-
59
-
60
-
61
-
62
-
63
-
64
-
65
-
66
-
67
-
68
-
69
-
70
-
71
-
72
-
73
-
74
-
75
-
76
-
77
-
78
-
79
-
80
-
81
-
82
-
83
-
84
-
85
-
86
-
87
-
88
-
89
-
90
-
91
-
92
-
93
-
94
-
95
-
96
-
97
-
98
-
99
-
100
-
101
-
102
-
103
-
104
-
105
-
106
-
107
-
108
-
109
-
110
-
111
-
 112
112 -
 113
113 -
 114
114 -
 115
115 -
 116
116 -
 117
117 -
 118
118 -
 119
119 -
 120
120 -
 121
121 -
 122
122 -
 123
123 -
 124
124 -
 125
125 -
 126
126 -
 127
127 -
 128
128 -
 129
129 -
 130
130 -
 131
131 -
 132
132 -
133
-
134
-
135
-
136
-
137
-
138
-
139
-
140
-
141
-
142
-
143
-
144
-
145
-
146
-
147
-
148
-
149
-
150
-
151
-
152
-
153
-
154
-
155
-
156
-
157
-
158
-
159
-
160
-
161
-
162
-
163
-
164
-
165
-
166
-
167
-
168
-
169
-
170
-
171
-
172
-
173
-
174
-
175
-
176
-
177
 |
 |

Table of Contents
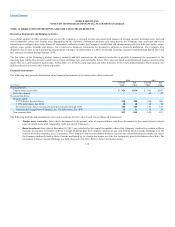
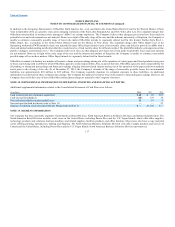
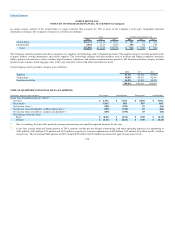
no single country outside of the United States or single customer that accounts for 10% or more of the Company’s total sales. Geographic financial
information relating to the Company’s business is as follows (in millions).
Sales Property and Equipment, Net
2013 2012 2013 2012
United States $ 8,119 $ 7,671 $ 977 $ 707
International 3,123 3,025 332 149
Total $11,242 $10,696 $ 1,309 $ 856
The Company classifies products into three categories: (1) supplies, (2) technology, and (3) furniture and other. The supplies category includes products such
as paper, binders, writing instruments, and school supplies. The technology category includes products such as desktop and laptop computers, monitors,
tablets, printers, ink and toner, cables, software, digital cameras, telephones, and wireless communications products. The furniture and other category includes
products such as desks, chairs, luggage, sales in the copy and print centers, and other miscellaneous items.
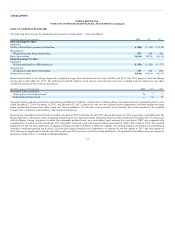
Total Company sales by product category were as follows:
2013 2012
Supplies 46.6% 45.8%
Technology 40.6% 41.8%
Furniture and other 12.8% 12.4%
100.0% 100.0%
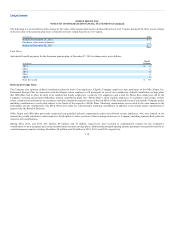
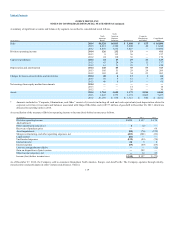
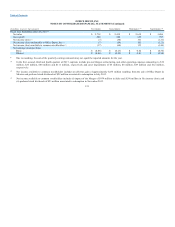
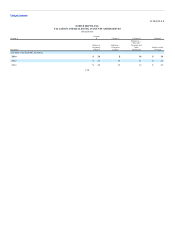
(In millions, except per share amounts) First Quarter Second Quarter Third Quarter Fourth Quarter
Fiscal Year Ended December 27, 2014*
Net sales
Gross profit
Net income (loss)
Net income (loss) attributable to Office Depot, Inc.
Net income (loss) available to common stockholders
Net earnings (loss) per share:
Basic
Diluted
* Due to rounding, the sum of the quarterly earnings amounts may not equal the reported amounts for the year.
In the first, second, third and fourth quarters of 2014, captions include pre-tax Merger, restructuring, and other operating expenses, net amounting to
$101 million, $103 million, $72 million and $128 million, respectively and asset impairments of $50 million, $22 million, $6 million and $11 million,
respectively. The second and third quarters of 2014 include $80 million and $1 million associated to Legal accrual, respectively.
120
(1)
(1)
(1)
(1)