OfficeMax 2014 Annual Report Download - page 115
Download and view the complete annual report
Please find page 115 of the 2014 OfficeMax annual report below. You can navigate through the pages in the report by either clicking on the pages listed below, or by using the keyword search tool below to find specific information within the annual report.-
 1
1 -
2
-
3
-
4
-
5
-
6
-
7
-
8
-
9
-
10
-
11
-
12
-
13
-
14
-
15
-
16
-
17
-
18
-
19
-
20
-
21
-
22
-
23
-
24
-
25
-
26
-
27
-
28
-
29
-
30
-
31
-
32
-
33
-
34
-
35
-
36
-
37
-
38
-
39
-
40
-
41
-
42
-
43
-
44
-
45
-
46
-
47
-
48
-
49
-
50
-
51
-
52
-
53
-
54
-
55
-
56
-
57
-
58
-
59
-
60
-
61
-
62
-
63
-
64
-
65
-
66
-
67
-
68
-
69
-
70
-
71
-
72
-
73
-
74
-
75
-
76
-
77
-
78
-
79
-
80
-
81
-
82
-
83
-
84
-
85
-
86
-
87
-
88
-
89
-
90
-
91
-
92
-
93
-
94
-
95
-
96
-
97
-
98
-
99
-
100
-
101
-
102
-
103
-
104
-
 105
105 -
 106
106 -
 107
107 -
 108
108 -
 109
109 -
 110
110 -
 111
111 -
 112
112 -
 113
113 -
 114
114 -
 115
115 -
 116
116 -
 117
117 -
 118
118 -
 119
119 -
 120
120 -
 121
121 -
 122
122 -
 123
123 -
 124
124 -
 125
125 -
126
-
127
-
128
-
129
-
130
-
131
-
132
-
133
-
134
-
135
-
136
-
137
-
138
-
139
-
140
-
141
-
142
-
143
-
144
-
145
-
146
-
147
-
148
-
149
-
150
-
151
-
152
-
153
-
154
-
155
-
156
-
157
-
158
-
159
-
160
-
161
-
162
-
163
-
164
-
165
-
166
-
167
-
168
-
169
-
170
-
171
-
172
-
173
-
174
-
175
-
176
-
177
 |
 |

Table of Contents
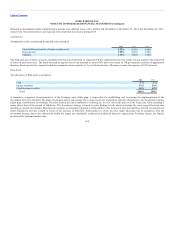
• Recourse debt for which there were no transactions on the measurement date was valued based on quoted market prices near the
measurement date when available or by discounting the future cash flows of each instrument using rates based on the most recently observable
trade or using rates currently offered to the Company for similar debt instruments of comparable maturities (Level 2 measure).
• Fair value is estimated by discounting the future cash flows of the instrument at rates currently available to the Company for
similar instruments of comparable maturities (Level 2 measure).
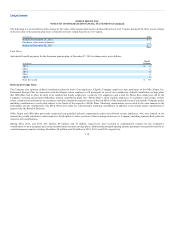
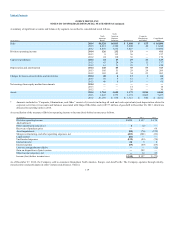
All impairment charges discussed in the sections below are presented in Asset impairments in the Consolidated Statements of Operations.
Because of declining sales in recent periods and adoption of the Real Estate Strategy in 2014, the Company has conducted a detailed quarterly store
impairment analysis. The analysis uses input from retail store operations and the Company’s accounting and finance personnel that organizationally report to
the Chief Financial Officer. These Level 3 projections are based on management’s estimates of store-level sales, gross margins, direct expenses, exercise of
future lease renewal options where applicable, and resulting cash flows and, by their nature, include judgments about how current initiatives will impact
future performance. If the anticipated cash flows of a store cannot support the carrying value of its assets, the assets are impaired and written down to
estimated fair value using Level 3 measure. The Company recognized store asset impairment charges of $25 million, $26 million, and $124 million in 2014,
2013, and 2012, respectively.
Following the Merger, the asset group tested for impairment included the retail store operating assets, as well as any favorable lease intangible asset. The
impairment results of this analysis are addressed in the following paragraph for the operating assets and in the Intangible Assets, Software and Definite-lived
intangible assets sections, respectively.
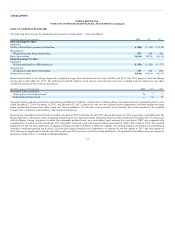
The 2014 analysis incorporated the probability assessment of which stores will be closed through 2016, as well as projected cash flows through the base lease
period for stores identified for ongoing operations. The projections assumed flat sales for one year, decreasing thereafter. Gross margin assumptions have been
held constant at current actual levels and operating costs have been assumed to be consistent with recent actual results and planned activities. For the fourth
quarter 2014 impairment analysis, identified locations were reduced to estimated fair value of $1 million based on their projected cash flows, discounted at
13% or estimated salvage value of $2 million, as appropriate. The Company continues to capitalize additions to previously-impaired operating stores and
tests for subsequent impairment. A 100 basis point decrease in next year sales combined with a 50 basis point decrease in next year gross margin would have
increased the impairment by approximately $1 million. Further, a 100 basis point decrease in sales for all future periods would increase the impairment by
approximately $1 million. The 2014 store impairment charge also includes $1 million related to the closure of stores in Canada.
The store impairment analysis for 2013 projected sales declines for several years, then stabilizing. Gross margin and operating cost assumptions were
consistent with actual results and planned activities. For the 2013 impairment analysis, identified locations were reduced to estimated fair value of $10
million based on their projected cash flows, discounted at 13% or estimated salvage value of $7 million, as appropriate.
113