OfficeMax 2014 Annual Report Download - page 32
Download and view the complete annual report
Please find page 32 of the 2014 OfficeMax annual report below. You can navigate through the pages in the report by either clicking on the pages listed below, or by using the keyword search tool below to find specific information within the annual report.-
 1
1 -
2
-
3
-
4
-
5
-
6
-
7
-
8
-
9
-
10
-
11
-
12
-
13
-
14
-
15
-
16
-
17
-
18
-
19
-
20
-
21
-
 22
22 -
 23
23 -
 24
24 -
 25
25 -
 26
26 -
 27
27 -
 28
28 -
 29
29 -
 30
30 -
 31
31 -
 32
32 -
 33
33 -
 34
34 -
 35
35 -
 36
36 -
 37
37 -
 38
38 -
 39
39 -
 40
40 -
 41
41 -
 42
42 -
43
-
44
-
45
-
46
-
47
-
48
-
49
-
50
-
51
-
52
-
53
-
54
-
55
-
56
-
57
-
58
-
59
-
60
-
61
-
62
-
63
-
64
-
65
-
66
-
67
-
68
-
69
-
70
-
71
-
72
-
73
-
74
-
75
-
76
-
77
-
78
-
79
-
80
-
81
-
82
-
83
-
84
-
85
-
86
-
87
-
88
-
89
-
90
-
91
-
92
-
93
-
94
-
95
-
96
-
97
-
98
-
99
-
100
-
101
-
102
-
103
-
104
-
105
-
106
-
107
-
108
-
109
-
110
-
111
-
112
-
113
-
114
-
115
-
116
-
117
-
118
-
119
-
120
-
121
-
122
-
123
-
124
-
125
-
126
-
127
-
128
-
129
-
130
-
131
-
132
-
133
-
134
-
135
-
136
-
137
-
138
-
139
-
140
-
141
-
142
-
143
-
144
-
145
-
146
-
147
-
148
-
149
-
150
-
151
-
152
-
153
-
154
-
155
-
156
-
157
-
158
-
159
-
160
-
161
-
162
-
163
-
164
-
165
-
166
-
167
-
168
-
169
-
170
-
171
-
172
-
173
-
174
-
175
-
176
-
177
 |
 |
Table of Contents
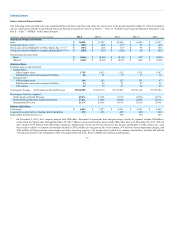
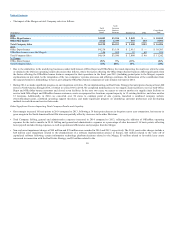
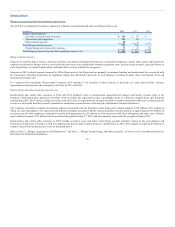
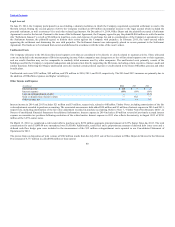
• The impact of the Merger on total Company sales is as follows:
(In millions)
North
American
Retail
North
American
Business
Solutions International Other
Consolidated
Total
2013
Office Depot banner $4,230 $3,158 $ 2,915 $ — $ 10,303
OfficeMax banner (since the Merger) 384 422 93 40 939
Total Company Sales $4,614 $3,580 $ 3,008 $ 40 $ 11,242
% Change
Office Depot banner
Total Company Sales
• Due to the similarities in the underlying businesses under both banners (Office Depot and OfficeMax), the trends impacting the results are often the same
or similar. In the Division operating results discussion that follows, where the factors affecting the Office Depot banner business differ significantly from
the factors affecting the OfficeMax banner business compared to their operations in the fiscal year 2013 (including period prior to the Merger), separate
explanations are provided. As the integration of the two companies’ systems, processes and offerings continues, the delineation of the contribution from
the separate banners is diminishing; however, providing the OfficeMax banner component of sales remains relevant for 2014.
• During 2014, we made significant progress on our integration activities. We are implementing our Real Estate Strategy that anticipates closing at least 400
stores in North America through 2016, of which we closed 168 in 2014. We completed modifications to two supply chain facilities to service both Office
Depot and OfficeMax banner customers and closed seven facilities. In the next two years, we expect to convert another six supply chain facilities to
service both Office Depot and OfficeMax banner customers, create or repurpose five locations, expand capacity in 12 existing facilities, and close another
12 locations. Additionally, in 2014, we converted over 50 stores to common point of sale systems, launched a combined company website
(www.officedepot.com), combined operating support functions, and made significant progress on identifying customer preferences and developing
methods to reach them and service their needs.
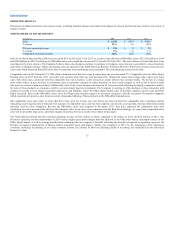
Other Significant Factors Impacting Total Company Results and Liquidity
• Gross margin increased 10 basis points in 2014 compared to 2013, following a 36 basis point decrease in the prior year to year comparison. An increase in
gross margin in the North American Retail Division was partially offset by decreases in the other Divisions.
• Total Company Selling, general and administrative expenses increased in 2014 compared to 2013, reflecting the addition of OfficeMax operating
expenses for the twelve months in 2014. Selling and general and administrative expenses as a percentage of sales decreased 116 basis points, reflecting
lower payroll and advertising expenses, as well as operational efficiencies and synergies from the Merger.
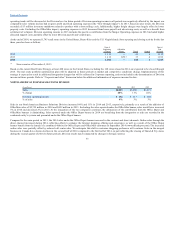
• Non-cash asset impairment charges of $88 million and $70 million were recorded in 2014 and 2013, respectively. The 2014 year-to-date charges include a
$28 million asset impairment related to the abandonment of a software implementation project in Europe, $25 million related to the write off of
capitalized software following certain information technology platform decisions related to the Merger, $5 million related to favorable lease assets
reassessed in connection with the Real Estate Strategy, and $5 million related to the
30