OfficeMax 2014 Annual Report Download - page 39
Download and view the complete annual report
Please find page 39 of the 2014 OfficeMax annual report below. You can navigate through the pages in the report by either clicking on the pages listed below, or by using the keyword search tool below to find specific information within the annual report.-
 1
1 -
2
-
3
-
4
-
5
-
6
-
7
-
8
-
9
-
10
-
11
-
12
-
13
-
14
-
15
-
16
-
17
-
18
-
19
-
20
-
21
-
22
-
23
-
24
-
25
-
26
-
27
-
28
-
 29
29 -
 30
30 -
 31
31 -
 32
32 -
 33
33 -
 34
34 -
 35
35 -
 36
36 -
 37
37 -
 38
38 -
 39
39 -
 40
40 -
 41
41 -
 42
42 -
 43
43 -
 44
44 -
 45
45 -
 46
46 -
 47
47 -
 48
48 -
 49
49 -
50
-
51
-
52
-
53
-
54
-
55
-
56
-
57
-
58
-
59
-
60
-
61
-
62
-
63
-
64
-
65
-
66
-
67
-
68
-
69
-
70
-
71
-
72
-
73
-
74
-
75
-
76
-
77
-
78
-
79
-
80
-
81
-
82
-
83
-
84
-
85
-
86
-
87
-
88
-
89
-
90
-
91
-
92
-
93
-
94
-
95
-
96
-
97
-
98
-
99
-
100
-
101
-
102
-
103
-
104
-
105
-
106
-
107
-
108
-
109
-
110
-
111
-
112
-
113
-
114
-
115
-
116
-
117
-
118
-
119
-
120
-
121
-
122
-
123
-
124
-
125
-
126
-
127
-
128
-
129
-
130
-
131
-
132
-
133
-
134
-
135
-
136
-
137
-
138
-
139
-
140
-
141
-
142
-
143
-
144
-
145
-
146
-
147
-
148
-
149
-
150
-
151
-
152
-
153
-
154
-
155
-
156
-
157
-
158
-
159
-
160
-
161
-
162
-
163
-
164
-
165
-
166
-
167
-
168
-
169
-
170
-
171
-
172
-
173
-
174
-
175
-
176
-
177
 |
 |

Table of Contents
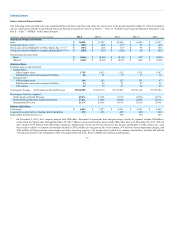
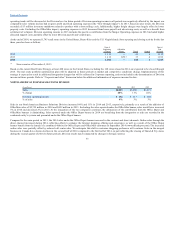
37.7 million (approximately $58 million at then-current exchange rates) to the pension plan, resulting in the plan changing from an unfunded liability
position to a net asset position. There are no additional funding requirements while the plan is in a surplus position.
This pension provision of the SPA was disclosed in 2003 and subsequent periods as a matter that would reduce goodwill when the plan was remeasured and
cash received. However, all goodwill associated with this transaction was impaired in 2008, and because the remeasurement process had not yet begun, no
estimate of the potential payment to the Company could be made at that time. Consistent with disclosures subsequent to the 2008 goodwill impairment,
resolution of this matter in the first quarter of 2012 was reflected as a credit to operating expense. The cash received from the seller, reversal of an accrued
liability as a result of the settlement agreement, fees incurred in 2012, and fee reimbursement from the seller have been reported in Recovery of purchase price
in the Consolidated Statements of Operations for 2012, totaling $68 million. An additional expense of $5 million of costs related to this arrangement is
included in Merger, restructuring and other operating expenses, net, resulting in a net increase in operating profit for 2012 of $63 million. Refer to Note 14,
“Employee Benefit Plans — Pension Plans-Europe” of the Consolidated Financial Statements for additional information about this pension plan.
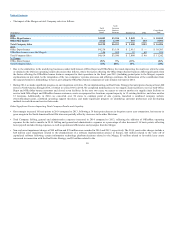
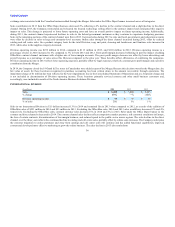
In recent years, we have taken actions to adapt to changing and competitive conditions. These actions include closing stores and distribution centers,
consolidating functional activities, disposing of businesses and assets, and improving process efficiencies. We have also recognized significant asset
impairment charges related to stores and intangible assets and significant expenses associated with the Merger and integration. These expense items are
expected to continue in future periods.
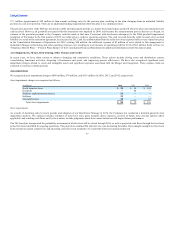
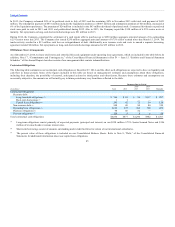
Asset impairments
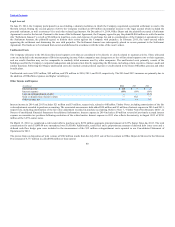
We recognized asset impairment charges of $88 million, $70 million, and $139 million in 2014, 2013, and 2012, respectively.
Asset impairment charges are comprised as follows:
(In millions) 2013 2012
North America stores $ 26 $ 124
Goodwill 44 —
Software implementation project — —
Software — —
Intangible assets — 15
Total Asset impairments $ 70 $ 139
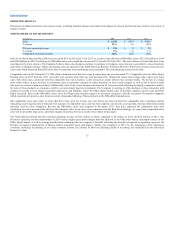
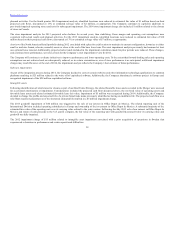
Store impairments
As a result of declining sales in recent periods and adoption of our Real Estate Strategy in 2014, the Company has conducted a detailed quarterly store
impairment analysis. The analysis includes estimates of store-level sales, gross margins, direct expenses, exercise of future lease renewal options where
applicable, and resulting cash flows and, by their nature, include judgments about how current initiatives will impact future performance.
The 2014 analysis incorporated the probability assessment of which stores will be closed through 2016, as well as projected cash flows through the base lease
period for stores identified for ongoing operations. The projections assumed flat sales for one year, decreasing thereafter. Gross margin assumptions have been
held constant at current actual levels and operating costs have been assumed to be consistent with recent actual results and
37