OfficeMax 2014 Annual Report Download - page 110
Download and view the complete annual report
Please find page 110 of the 2014 OfficeMax annual report below. You can navigate through the pages in the report by either clicking on the pages listed below, or by using the keyword search tool below to find specific information within the annual report.-
 1
1 -
2
-
3
-
4
-
5
-
6
-
7
-
8
-
9
-
10
-
11
-
12
-
13
-
14
-
15
-
16
-
17
-
18
-
19
-
20
-
21
-
22
-
23
-
24
-
25
-
26
-
27
-
28
-
29
-
30
-
31
-
32
-
33
-
34
-
35
-
36
-
37
-
38
-
39
-
40
-
41
-
42
-
43
-
44
-
45
-
46
-
47
-
48
-
49
-
50
-
51
-
52
-
53
-
54
-
55
-
56
-
57
-
58
-
59
-
60
-
61
-
62
-
63
-
64
-
65
-
66
-
67
-
68
-
69
-
70
-
71
-
72
-
73
-
74
-
75
-
76
-
77
-
78
-
79
-
80
-
81
-
82
-
83
-
84
-
85
-
86
-
87
-
88
-
89
-
90
-
91
-
92
-
93
-
94
-
95
-
96
-
97
-
98
-
99
-
 100
100 -
 101
101 -
 102
102 -
 103
103 -
 104
104 -
 105
105 -
 106
106 -
 107
107 -
 108
108 -
 109
109 -
 110
110 -
 111
111 -
 112
112 -
 113
113 -
 114
114 -
 115
115 -
 116
116 -
 117
117 -
 118
118 -
 119
119 -
 120
120 -
121
-
122
-
123
-
124
-
125
-
126
-
127
-
128
-
129
-
130
-
131
-
132
-
133
-
134
-
135
-
136
-
137
-
138
-
139
-
140
-
141
-
142
-
143
-
144
-
145
-
146
-
147
-
148
-
149
-
150
-
151
-
152
-
153
-
154
-
155
-
156
-
157
-
158
-
159
-
160
-
161
-
162
-
163
-
164
-
165
-
166
-
167
-
168
-
169
-
170
-
171
-
172
-
173
-
174
-
175
-
176
-
177
 |
 |

Table of Contents
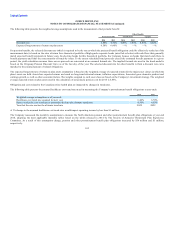
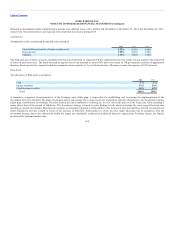
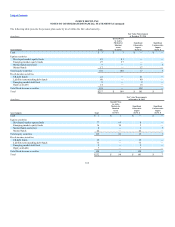
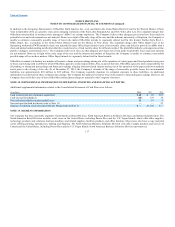
Included in Accumulated other comprehensive income were deferred losses of $1 million and $8 million at December 27, 2014 and December 28, 2013,
respectively. The deferred loss is not expected to be amortized into income during 2015.
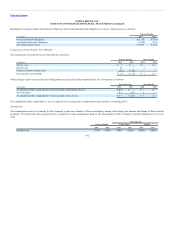
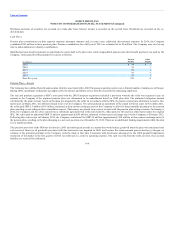
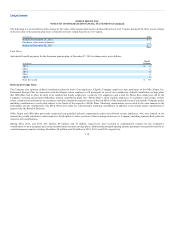
Assumptions
Assumptions used in calculating the funded status included:
2013 2012
Expected long-term rate of return on plan assets 6.33% 6.00%
Discount rate 4.60% 4.40%
Inflation 3.40% 3.00%
The long-term rate of return on assets assumption has been derived based on long-term UK government fixed income yields, having regard to the proportion
of assets in each asset class. The funds invested in equities have been assumed to return 4.0% above the return on UK government securities of appropriate
duration. Funds invested in corporate bonds are assumed to return equal to a 15 year AA bond index. Allowance is made for expenses of 0.5% of assets.
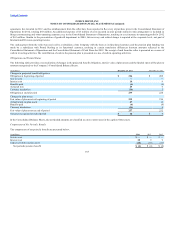
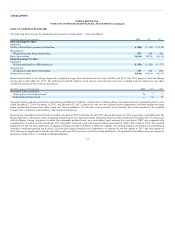
Plan Assets
The allocation of Plan assets is as follows:
2013
Cash
Equity securities
Fixed-income securities
Total
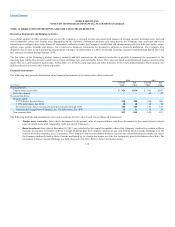
A committee, comprised of representatives of the Company and of this plan, is responsible for establishing and overseeing the implementation of the
investment policy for this plan. The plan’s investment policy and strategy are to ensure assets are available to meet the obligations to the beneficiaries and to
adjust plan contributions accordingly. The plan trustees are also committed to reducing the level of risk in the plan over the long term, while retaining a
return above that of the growth of liabilities. The investment strategy is based on plan funding levels, which determine the asset target allocation into
matching or growth investments. Matching investments are intended to provide a return similar to the increase in the plan liabilities. Growth investments are
assets intended to provide a return in excess of the increase in liabilities. At December 27, 2014, the asset target allocation was in accordance with the
investment strategy. Asset-class allocations within the ranges are continually evaluated and adjusted based on expectations for future returns, the funded
position of the plan and market risks.
108