OfficeMax 2014 Annual Report Download - page 105
Download and view the complete annual report
Please find page 105 of the 2014 OfficeMax annual report below. You can navigate through the pages in the report by either clicking on the pages listed below, or by using the keyword search tool below to find specific information within the annual report.-
 1
1 -
2
-
3
-
4
-
5
-
6
-
7
-
8
-
9
-
10
-
11
-
12
-
13
-
14
-
15
-
16
-
17
-
18
-
19
-
20
-
21
-
22
-
23
-
24
-
25
-
26
-
27
-
28
-
29
-
30
-
31
-
32
-
33
-
34
-
35
-
36
-
37
-
38
-
39
-
40
-
41
-
42
-
43
-
44
-
45
-
46
-
47
-
48
-
49
-
50
-
51
-
52
-
53
-
54
-
55
-
56
-
57
-
58
-
59
-
60
-
61
-
62
-
63
-
64
-
65
-
66
-
67
-
68
-
69
-
70
-
71
-
72
-
73
-
74
-
75
-
76
-
77
-
78
-
79
-
80
-
81
-
82
-
83
-
84
-
85
-
86
-
87
-
88
-
89
-
90
-
91
-
92
-
93
-
94
-
 95
95 -
 96
96 -
 97
97 -
 98
98 -
 99
99 -
 100
100 -
 101
101 -
 102
102 -
 103
103 -
 104
104 -
 105
105 -
 106
106 -
 107
107 -
 108
108 -
 109
109 -
 110
110 -
 111
111 -
 112
112 -
 113
113 -
 114
114 -
 115
115 -
116
-
117
-
118
-
119
-
120
-
121
-
122
-
123
-
124
-
125
-
126
-
127
-
128
-
129
-
130
-
131
-
132
-
133
-
134
-
135
-
136
-
137
-
138
-
139
-
140
-
141
-
142
-
143
-
144
-
145
-
146
-
147
-
148
-
149
-
150
-
151
-
152
-
153
-
154
-
155
-
156
-
157
-
158
-
159
-
160
-
161
-
162
-
163
-
164
-
165
-
166
-
167
-
168
-
169
-
170
-
171
-
172
-
173
-
174
-
175
-
176
-
177
 |
 |

Table of Contents
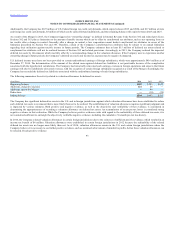
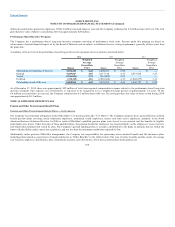
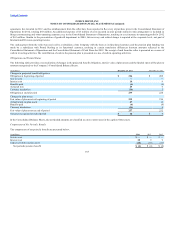
The following table presents the weighted average assumptions used in the measurement of net periodic benefit:
Discount rate 4.84% 4.76% 4.00% 3.80% 4.80% 4.60%
Expected long-term rate of return on plan assets 6.50% 6.60% —% —% —% —%
For pension benefits, the selected discount rate (which is required to be the rate at which the projected benefit obligation could be effectively settled as of the
measurement date) is based on the rates of return for a theoretical portfolio of high-grade corporate bonds (rated AA or better) with cash flows that generally
match expected benefit payments in future years. In selecting bonds for this theoretical portfolio, the Company focuses on bonds that match cash flows to
benefit payments and limit the concentration of bonds by issuer. To the extent scheduled bond proceeds exceed the estimated benefit payments in a given
period, the yield calculation assumes those excess proceeds are reinvested at an assumed forward rate. The implied forward rate used in the bond model is
based on the Citigroup Pension Discount Curve as of the last day of the year. The selected discount rate for other benefits is from a discount rate curve
matched to the assumed payout of related obligations.
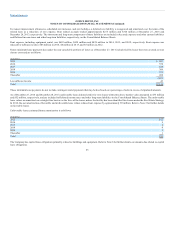
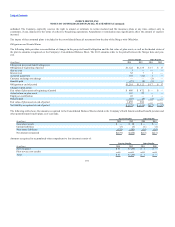
The expected long-term rate of return on plan assets assumption is based on the weighted average of expected returns for the major asset classes in which the
plans’ assets are held. Asset-class expected returns are based on long-term historical returns, inflation expectations, forecasted gross domestic product and
earnings growth, as well as other economic factors. The weights assigned to each asset class are based on the Company’s investment strategy. The weighted
average expected return on plan assets used in the calculation of net periodic pension cost for 2015 is 5.85%.
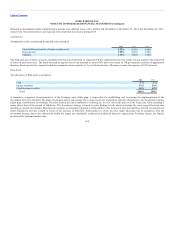
Obligation and costs related to the Canadian retiree health plan are impacted by changes in trend rates.
The following table presents the assumed healthcare cost trend rates used in measuring the Company’s postretirement benefit obligations at year-ends:
Weighted average assumptions as of year-end:
Healthcare cost trend rate assumed for next year 6.40% 6.70%
Rate to which the cost trend rate is assumed to decline (the ultimate trend rate) 4.50% 4.50%
Year that the rate reaches the ultimate trend rate 2022 2022
A 1% change in the assumed healthcare cost trend rates would impact operating income by less than $1 million.
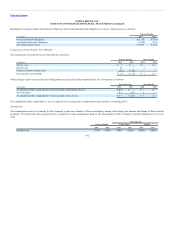
The Company reassessed the mortality assumptions to measure the North American pension and other postretirement benefit plan obligations at year end
2014, adopting the most applicable mortality tables based on the tables released in 2014 by The Society of Actuaries’ Retirement Plan Experience
Committee. As a result of this assumption change, pension and other postretirement benefit plan obligations increased by $36 million and $1 million,
respectively.
103