OfficeMax 2014 Annual Report Download - page 37
Download and view the complete annual report
Please find page 37 of the 2014 OfficeMax annual report below. You can navigate through the pages in the report by either clicking on the pages listed below, or by using the keyword search tool below to find specific information within the annual report.-
 1
1 -
2
-
3
-
4
-
5
-
6
-
7
-
8
-
9
-
10
-
11
-
12
-
13
-
14
-
15
-
16
-
17
-
18
-
19
-
20
-
21
-
22
-
23
-
24
-
25
-
26
-
 27
27 -
 28
28 -
 29
29 -
 30
30 -
 31
31 -
 32
32 -
 33
33 -
 34
34 -
 35
35 -
 36
36 -
 37
37 -
 38
38 -
 39
39 -
 40
40 -
 41
41 -
 42
42 -
 43
43 -
 44
44 -
 45
45 -
 46
46 -
 47
47 -
48
-
49
-
50
-
51
-
52
-
53
-
54
-
55
-
56
-
57
-
58
-
59
-
60
-
61
-
62
-
63
-
64
-
65
-
66
-
67
-
68
-
69
-
70
-
71
-
72
-
73
-
74
-
75
-
76
-
77
-
78
-
79
-
80
-
81
-
82
-
83
-
84
-
85
-
86
-
87
-
88
-
89
-
90
-
91
-
92
-
93
-
94
-
95
-
96
-
97
-
98
-
99
-
100
-
101
-
102
-
103
-
104
-
105
-
106
-
107
-
108
-
109
-
110
-
111
-
112
-
113
-
114
-
115
-
116
-
117
-
118
-
119
-
120
-
121
-
122
-
123
-
124
-
125
-
126
-
127
-
128
-
129
-
130
-
131
-
132
-
133
-
134
-
135
-
136
-
137
-
138
-
139
-
140
-
141
-
142
-
143
-
144
-
145
-
146
-
147
-
148
-
149
-
150
-
151
-
152
-
153
-
154
-
155
-
156
-
157
-
158
-
159
-
160
-
161
-
162
-
163
-
164
-
165
-
166
-
167
-
168
-
169
-
170
-
171
-
172
-
173
-
174
-
175
-
176
-
177
 |
 |
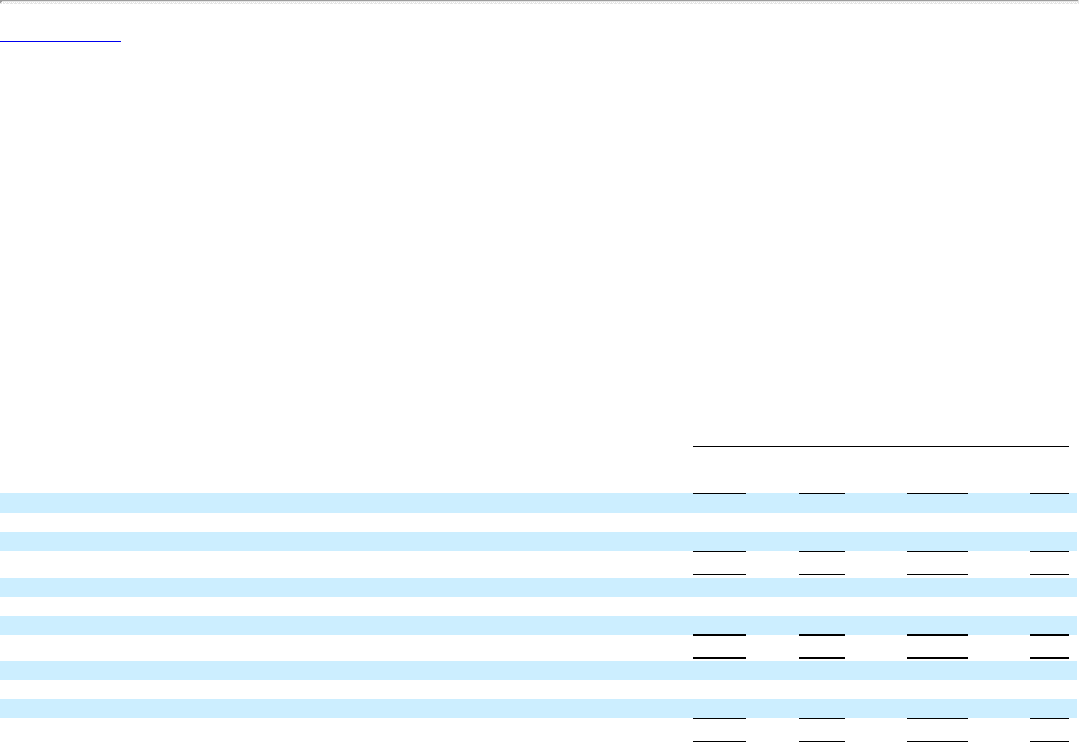
Table of Contents
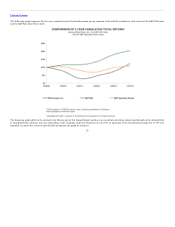
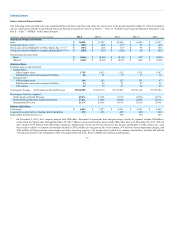
competitive pressures and soft economic conditions in Europe, as well as the discontinuation of certain less profitable contract accounts. Retail sales were
lower in 2013, reflecting the disposition of stores in Hungary in late 2012.
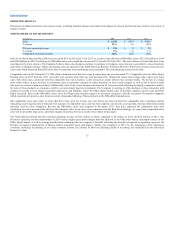
Division operating income totaled $53 million in 2014, compared to $36 million in both 2013 and 2012. Division operating income as a percentage of sales
was 2% in 2014 and 1% for both 2013 and 2012. The improvement in Division operating income reflects benefits from lower payroll and advertising, as well
as benefits associated to prior restructuring activities under the Office Depot banner. Division operating income in 2013 reflects the negative flow-through
impact of lower sales, offset by the favorable impact of operational efficiencies, and the inclusion of a slightly positive OfficeMax contribution in 2013 since
the date of the Merger. Operating expenses decreased across the Division in 2013, reflecting benefits from current and prior period restructuring activities.
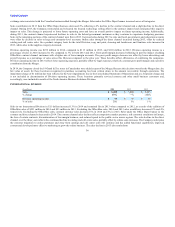
During 2014, the Division announced a restructuring plan to align the organization from a geographic-focus to a channel-focus. The restructuring plan is
intended to provide operational efficiency and allow enhanced customer service and is expected to benefit future Division operating results. Costs associated
with restructuring activities, including employee termination benefits, lease obligations and other costs, are reported at the Corporate level and discussed in
the “Restructuring and other operating expenses, net” section below.
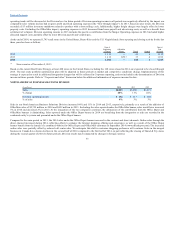
For U.S. reporting, the International Division’s sales are translated into U.S. dollars at average exchange rates experienced during the year. The Division’s
reported sales were positively impacted from changes in foreign currency exchange rates by approximately $35 million and $52 million in 2014 and 2013,
respectively. Internally, we analyze our international operations in terms of local currency performance to allow focus on operating trends and results.
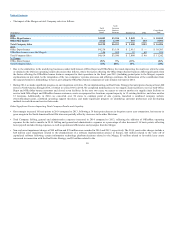
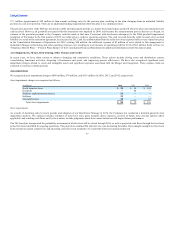
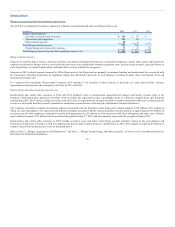
International Division store count and activity is summarized below:
Office Supply Stores
Open at
Beginning
of Period
Opened/
Acquired
Closed/
Changed
Designation
Open at
End of
Period
Company-Owned Stores 131 4 12 123
Operated by Joint Ventures 232 16 — 248
Franchise and Licensing Arrangements 183 7 44 146
Total stores 2012 546 27 56 517
Company-Owned Stores 123 25 4 144
Operated by Joint Ventures 248 96 251 93
Franchise and Licensing Arrangements 146 8 39 115
Total stores 2013 517 129 294 352
38 of these stores relate to the termination of the Thailand license agreement.
Includes 249 stores operated by Office Depot de Mexico, which the Company sold its interest in during 2013.
22 Company–owned stores and 93 stores operated by Grupo OfficeMax.
Stores operated by Grupo OfficeMax, which the Company sold its interest in the third quarter of 2014.
35
(1)
(3)
(3) (2)
(1)
(2)
(3)
(4)