OfficeMax 2014 Annual Report Download - page 36
Download and view the complete annual report
Please find page 36 of the 2014 OfficeMax annual report below. You can navigate through the pages in the report by either clicking on the pages listed below, or by using the keyword search tool below to find specific information within the annual report.-
 1
1 -
2
-
3
-
4
-
5
-
6
-
7
-
8
-
9
-
10
-
11
-
12
-
13
-
14
-
15
-
16
-
17
-
18
-
19
-
20
-
21
-
22
-
23
-
24
-
25
-
 26
26 -
 27
27 -
 28
28 -
 29
29 -
 30
30 -
 31
31 -
 32
32 -
 33
33 -
 34
34 -
 35
35 -
 36
36 -
 37
37 -
 38
38 -
 39
39 -
 40
40 -
 41
41 -
 42
42 -
 43
43 -
 44
44 -
 45
45 -
 46
46 -
47
-
48
-
49
-
50
-
51
-
52
-
53
-
54
-
55
-
56
-
57
-
58
-
59
-
60
-
61
-
62
-
63
-
64
-
65
-
66
-
67
-
68
-
69
-
70
-
71
-
72
-
73
-
74
-
75
-
76
-
77
-
78
-
79
-
80
-
81
-
82
-
83
-
84
-
85
-
86
-
87
-
88
-
89
-
90
-
91
-
92
-
93
-
94
-
95
-
96
-
97
-
98
-
99
-
100
-
101
-
102
-
103
-
104
-
105
-
106
-
107
-
108
-
109
-
110
-
111
-
112
-
113
-
114
-
115
-
116
-
117
-
118
-
119
-
120
-
121
-
122
-
123
-
124
-
125
-
126
-
127
-
128
-
129
-
130
-
131
-
132
-
133
-
134
-
135
-
136
-
137
-
138
-
139
-
140
-
141
-
142
-
143
-
144
-
145
-
146
-
147
-
148
-
149
-
150
-
151
-
152
-
153
-
154
-
155
-
156
-
157
-
158
-
159
-
160
-
161
-
162
-
163
-
164
-
165
-
166
-
167
-
168
-
169
-
170
-
171
-
172
-
173
-
174
-
175
-
176
-
177
 |
 |

Table of Contents
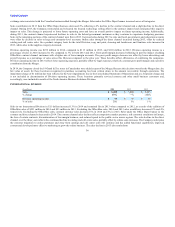
exchange rates associated with the Canadian business added through the Merger. Sales under the Office Depot banner increased across all categories.
Sales contribution in 2013 from the Office Depot business decreased 2%, reflecting a 2% decline in the contract channel and a slight decline in the direct
channel. During 2013, the Company restructured and relocated the focused technology selling effort in the contract channel and anticipated this negative
impact on sales. This change is projected to lower future operating costs and have an overall positive impact on future operating income. Additionally,
during 2013, the contract channel experienced declines in sales to the federal government customers as they continue to experience budgetary pressures.
Sales in the remaining portions of the contract channel were flat in 2013. Increased sales during 2013 to state and local governments and education accounts
were offset by declines in sales to large and enterprise-level accounts. Online sales through the direct channel increased during 2013, offset by reduced
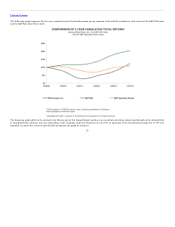
catalog and call center sales. On a product category basis for the total Division, copy and print, cleaning and breakroom, and furniture sales increased in
2013, while sales in the supplies category decreased.
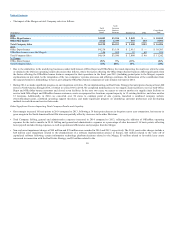
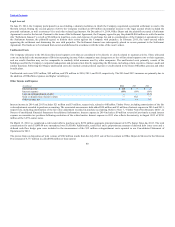
Division operating income was $232 million in 2014, compared to $113 million in 2013, and $110 million in 2012. Division operating income as a
percentage of sales in 2014 increased to 4% compared to 3% in both 2013 and 2012. Gross profit margin decreased reflecting in part the impact of adding
OfficeMax contract channel customers with a higher mix of lower margin accounts. The gross profit margin decrease was offset by lower advertising and
payroll expense as a percentage of sales across this Division compared to the prior year. These benefits reflect efficiencies of combining the companies.
Division operating income in 2013 reflects lower operating expenses, partially offset by legal expenses, relatively constant gross profit margin and a positive
contribution from the Merger.
In 2014, the Company closed the 19 Grand & Toy stores in Canada that were added as part of the Merger. Because this decision was after the Merger date, the
fair value of assets for these locations recognized in purchase accounting has been written down to the amount recoverable through operations. The
impairment charge of $1 million has been reflected in the Asset impairments line in the Consolidated Statement of Operations and as a Corporate charge and
is not included in determination of Division operating income. These locations primarily serviced contract and other small business customers and,
accordingly, were included in results of the North America Business Solutions Division.
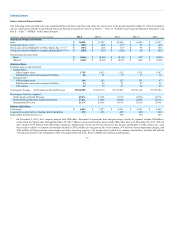
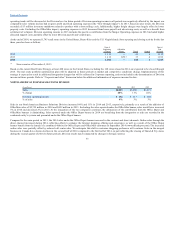
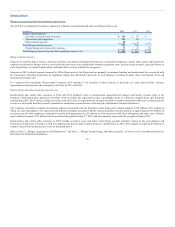
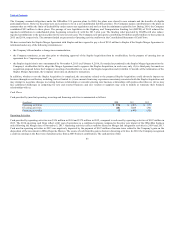
(In millions) 2013 2012
Sales $ 3,008 $ 3,023
% change —% (10)%
Division operating income $ 36 $ 36
% of sales 1% 1%
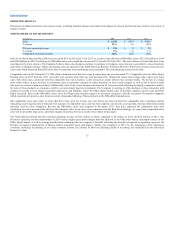
Sales in our International Division in U.S. dollars increased 13% in 2014 and remained flat in 2013 when compared to 2012, as a result of the addition of
OfficeMax sales of $551 million in 2014 and $93 million in 2013. Excluding the OfficeMax sales, 2014 and 2013 sales would have decreased 2% and 4%,
respectively. Excluding the OfficeMax sales, constant currency sales decreased 3% in 2014 and 5% in 2013. Sales under the Office Depot banner in the
contract and direct channels decreased in 2014. The contract channel sales decline reflects competitive market pressures, soft economic conditions in Europe,
the loss of certain contracts, discontinuation of low margin business, and reduced spend in the public sector across regions. The sales decline in the direct
channel over the three years reflects the continued decline in catalog and call center sales, partially offset by online sales increases. The Company anticipates
the customer migration to online purchases and away from catalogs and call center sales will continue and has added functional capabilities, improved
content and developed more effective marketing to grow the online business. The sales decline in 2013 also results from
34