OfficeMax 2014 Annual Report Download - page 101
Download and view the complete annual report
Please find page 101 of the 2014 OfficeMax annual report below. You can navigate through the pages in the report by either clicking on the pages listed below, or by using the keyword search tool below to find specific information within the annual report.-
 1
1 -
2
-
3
-
4
-
5
-
6
-
7
-
8
-
9
-
10
-
11
-
12
-
13
-
14
-
15
-
16
-
17
-
18
-
19
-
20
-
21
-
22
-
23
-
24
-
25
-
26
-
27
-
28
-
29
-
30
-
31
-
32
-
33
-
34
-
35
-
36
-
37
-
38
-
39
-
40
-
41
-
42
-
43
-
44
-
45
-
46
-
47
-
48
-
49
-
50
-
51
-
52
-
53
-
54
-
55
-
56
-
57
-
58
-
59
-
60
-
61
-
62
-
63
-
64
-
65
-
66
-
67
-
68
-
69
-
70
-
71
-
72
-
73
-
74
-
75
-
76
-
77
-
78
-
79
-
80
-
81
-
82
-
83
-
84
-
85
-
86
-
87
-
88
-
89
-
90
-
 91
91 -
 92
92 -
 93
93 -
 94
94 -
 95
95 -
 96
96 -
 97
97 -
 98
98 -
 99
99 -
 100
100 -
 101
101 -
 102
102 -
 103
103 -
 104
104 -
 105
105 -
 106
106 -
 107
107 -
 108
108 -
 109
109 -
 110
110 -
 111
111 -
112
-
113
-
114
-
115
-
116
-
117
-
118
-
119
-
120
-
121
-
122
-
123
-
124
-
125
-
126
-
127
-
128
-
129
-
130
-
131
-
132
-
133
-
134
-
135
-
136
-
137
-
138
-
139
-
140
-
141
-
142
-
143
-
144
-
145
-
146
-
147
-
148
-
149
-
150
-
151
-
152
-
153
-
154
-
155
-
156
-
157
-
158
-
159
-
160
-
161
-
162
-
163
-
164
-
165
-
166
-
167
-
168
-
169
-
170
-
171
-
172
-
173
-
174
-
175
-
176
-
177
 |
 |

Table of Contents
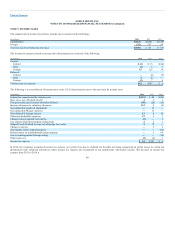
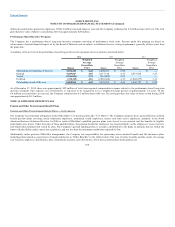
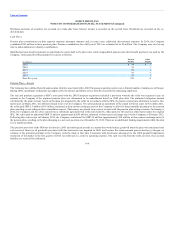
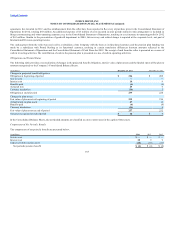
The following table summarizes information about options outstanding and exercisable at December 27, 2014.
Options Outstanding Options Exercisable
Range of
Exercise Prices
Number
Outstanding
Weighted Average
Remaining
Contractual Life
(in years)
Weighted
Average
Exercise
Price
Number
Exercisable
Weighted Average
Remaining
Contractual Life
(in years)
Weighted
Average
Exercise
Price
$0.83 $3.00 2,715,238 2.74 $ 1.42 2,220,878 2.43 $ 1.33
3.01 5.12 1,456,050 2.92 4.37 1,399,176 2.90 4.39
5.13 301,034 2.45 5.13 301,034 2.45 5.13
5.14 8.00 3,331,826 6.34 5.73 1,998,492 4.64 6.05
8.01 11.27 798,478 1.05 10.19 798,478 1.05 10.19
$0.83 $11.27 8,602,626 4.00 $ 4.53 6,718,058 3.02 $ 4.60
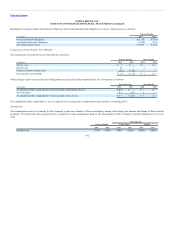
The intrinsic value of options exercised in 2014, 2013, and 2012, was $27 million, $10 million, and $4 million, respectively. The aggregate intrinsic value of
options outstanding and exercisable at December 27, 2014 were $38 million and $30 million, respectively.
As of December 27, 2014, there was approximately $4.1 million of total stock-based compensation expense that has not yet been recognized relating to non-
vested awards granted under option plans. This expense is expected to be recognized over a weighted-average period of approximately 1.8 years. The
Company estimates that all of the 1.9 million unvested options will vest. The number of exercisable options was 6.7 million shares of common stock at
December 27, 2014 and 16.9 million shares of common stock at December 28, 2013.
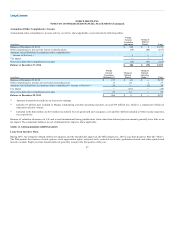
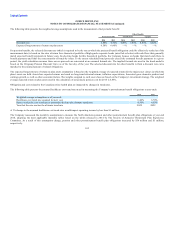
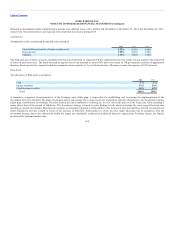
In 2014, the Company granted 5.8 million shares of restricted stock and restricted stock units to eligible employees. In addition, 0.3 million shares were
granted to the Board of Directors as part of their annual compensation and vested immediately on the grant date with distribution to occur following their
separation from service with the Company. Restricted stock grants to Company employees typically vest annually over a three-year service period. A
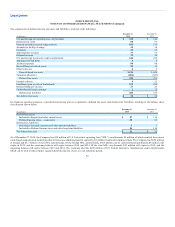
summary of the status of the Company’s nonvested shares and changes during 2014, 2013, and 2012 is presented below.
2013 2012
Shares
Weighted
Average
Grant-Date
Price Shares
Weighted
Average
Grant-Date
Price
Outstanding at beginning of year 5,459,900 $ 3.52 2,612,876 $ 3.96
Granted 4,884,848 4.54 4,018,253 3.26
Assumed — Merger 6,426,968 3.46 — —
Vested (5,788,992) 4.49 (695,751) 3.45
Forfeited (775,178) 4.01 (475,478) 3.79
Outstanding at end of year 10,207,546 $ 4.76 5,459,900 $ 3.52
As of December 27, 2014, there was approximately $27 million of total unrecognized compensation cost related to nonvested restricted stock. This expense,
net of forfeitures, is expected to be recognized over a weighted-average period of approximately 2 years. Total outstanding shares of 10.7 million include
1.7 million granted to members of the Board of Directors that have vested but will not be issued until separation from service and nine
99