OfficeMax 2014 Annual Report Download - page 34
Download and view the complete annual report
Please find page 34 of the 2014 OfficeMax annual report below. You can navigate through the pages in the report by either clicking on the pages listed below, or by using the keyword search tool below to find specific information within the annual report.-
 1
1 -
2
-
3
-
4
-
5
-
6
-
7
-
8
-
9
-
10
-
11
-
12
-
13
-
14
-
15
-
16
-
17
-
18
-
19
-
20
-
21
-
22
-
23
-
 24
24 -
 25
25 -
 26
26 -
 27
27 -
 28
28 -
 29
29 -
 30
30 -
 31
31 -
 32
32 -
 33
33 -
 34
34 -
 35
35 -
 36
36 -
 37
37 -
 38
38 -
 39
39 -
 40
40 -
 41
41 -
 42
42 -
 43
43 -
 44
44 -
45
-
46
-
47
-
48
-
49
-
50
-
51
-
52
-
53
-
54
-
55
-
56
-
57
-
58
-
59
-
60
-
61
-
62
-
63
-
64
-
65
-
66
-
67
-
68
-
69
-
70
-
71
-
72
-
73
-
74
-
75
-
76
-
77
-
78
-
79
-
80
-
81
-
82
-
83
-
84
-
85
-
86
-
87
-
88
-
89
-
90
-
91
-
92
-
93
-
94
-
95
-
96
-
97
-
98
-
99
-
100
-
101
-
102
-
103
-
104
-
105
-
106
-
107
-
108
-
109
-
110
-
111
-
112
-
113
-
114
-
115
-
116
-
117
-
118
-
119
-
120
-
121
-
122
-
123
-
124
-
125
-
126
-
127
-
128
-
129
-
130
-
131
-
132
-
133
-
134
-
135
-
136
-
137
-
138
-
139
-
140
-
141
-
142
-
143
-
144
-
145
-
146
-
147
-
148
-
149
-
150
-
151
-
152
-
153
-
154
-
155
-
156
-
157
-
158
-
159
-
160
-
161
-
162
-
163
-
164
-
165
-
166
-
167
-
168
-
169
-
170
-
171
-
172
-
173
-
174
-
175
-
176
-
177
 |
 |

Table of Contents
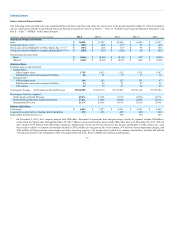
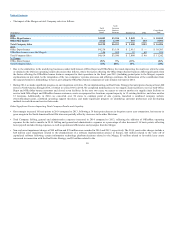
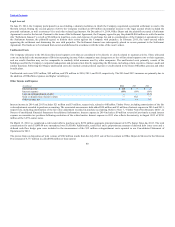
Discussion of additional income and expense items, including material charges and credits and changes in interest and income taxes follows our review of
segment results.
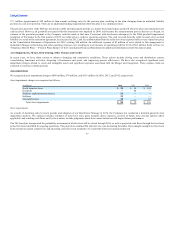
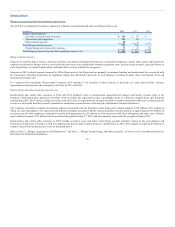
(In millions) 2013 2012
Sales $ 4,614 $ 4,458
% change 3% (8)%
Division operating income $ 8 $ 24
% of sales —% 1%
Comparable store sales decline (4)% (5)%
Sales in our North American Retail Division increased 41% in 2014 and 3% in 2013, as a result of the addition of OfficeMax sales of $2,526 million in 2014
and $384 million in 2013. Excluding the OfficeMax sales, sales would have decreased 5% in both 2014 and 2013. The sales decline in each of the three years
was impacted by store closures. The Company believes that some shoppers continue to purchase in Company stores that are in proximity to closed locations
and online or through catalogs. Online and catalog sales are reported in the North American Business Solutions Division. While store closures result in lower
sales in the North American Retail Division, they are typically lower performing stores and future Division operating results may benefit.
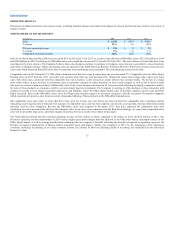
Comparable sales in 2014 from the 973 Office Depot branded stores that were open for more than one year decreased 2%. Comparable sales for Office Depot
branded stores in 2013 from the 1,071 stores that were open for more than one year decreased 4%. Transaction counts and average order values were lower
each of the three years, consistent with the comparable store sales declines. Lower transaction counts reflect lower customer traffic. The decline in average
order values reflect, in part, declines in technology sales as customers continue to reduce purchases in this overall category, as well as due to lower average
sale prices on certain computer products. Additionally, sales of ink, toner, and paper declined in all years presented reflecting the highly-competitive market
for sales of these products as consumers switch to an increasingly digital environment. The Company is working to offset declines in these categories with
enhanced customer service, improved product adjacencies and offerings. Under the Office Depot banner, sales of furniture, supplies, and in Copy and Print
Depot increased. Sales in the OfficeMax stores since the Merger date trended negative in the major categories, with the exception of portable computers,
which experienced a positive sales trend as a result of expanded offering of these products in the OfficeMax branded stores.
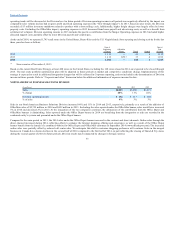
Our comparable store sales relate to stores that have been open for at least one year. Stores are removed from the comparable sales calculation during
remodeling and if significantly downsized. Our measure of comparable store sales has been applied consistently across periods, but may differ from similar
measures used by other companies. Because the OfficeMax stores were acquired in November 2013, they have impacted the comparable store sales
calculation for only a portion of the full year 2014 measure. Also, as we close stores consistent with the Real Estate Strategy, we expect that comparable store
sales will be favorably impacted as customers migrate from closed stores to nearby stores which remain open.
The North American Retail Division reported operating income of $126 million in 2014, compared to $8 million in 2013 and $24 million in 2012. The
Division’s operating income improvement in 2014 reflects higher gross profit margin from the addition of the OfficeMax banner and improvements in the
Office Depot banner, as well as synergy benefits from combining the two companies. Partially offsetting the benefits recognized in operating expenses, the
Division recognized amortization of Merger-related intangible assets and higher variable pay compared to 2013. As the integration of the businesses
continues, including the phasing in of certain common systems, the identity of Division operating results is becoming less identifiable at the individual
banner level and
32