OfficeMax 2014 Annual Report Download - page 114
Download and view the complete annual report
Please find page 114 of the 2014 OfficeMax annual report below. You can navigate through the pages in the report by either clicking on the pages listed below, or by using the keyword search tool below to find specific information within the annual report.-
 1
1 -
2
-
3
-
4
-
5
-
6
-
7
-
8
-
9
-
10
-
11
-
12
-
13
-
14
-
15
-
16
-
17
-
18
-
19
-
20
-
21
-
22
-
23
-
24
-
25
-
26
-
27
-
28
-
29
-
30
-
31
-
32
-
33
-
34
-
35
-
36
-
37
-
38
-
39
-
40
-
41
-
42
-
43
-
44
-
45
-
46
-
47
-
48
-
49
-
50
-
51
-
52
-
53
-
54
-
55
-
56
-
57
-
58
-
59
-
60
-
61
-
62
-
63
-
64
-
65
-
66
-
67
-
68
-
69
-
70
-
71
-
72
-
73
-
74
-
75
-
76
-
77
-
78
-
79
-
80
-
81
-
82
-
83
-
84
-
85
-
86
-
87
-
88
-
89
-
90
-
91
-
92
-
93
-
94
-
95
-
96
-
97
-
98
-
99
-
100
-
101
-
102
-
103
-
 104
104 -
 105
105 -
 106
106 -
 107
107 -
 108
108 -
 109
109 -
 110
110 -
 111
111 -
 112
112 -
 113
113 -
 114
114 -
 115
115 -
 116
116 -
 117
117 -
 118
118 -
 119
119 -
 120
120 -
 121
121 -
 122
122 -
 123
123 -
 124
124 -
125
-
126
-
127
-
128
-
129
-
130
-
131
-
132
-
133
-
134
-
135
-
136
-
137
-
138
-
139
-
140
-
141
-
142
-
143
-
144
-
145
-
146
-
147
-
148
-
149
-
150
-
151
-
152
-
153
-
154
-
155
-
156
-
157
-
158
-
159
-
160
-
161
-
162
-
163
-
164
-
165
-
166
-
167
-
168
-
169
-
170
-
171
-
172
-
173
-
174
-
175
-
176
-
177
 |
 |

Table of Contents
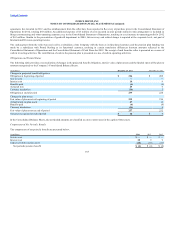
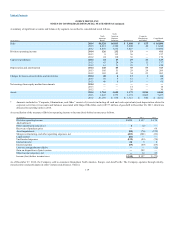
As a global supplier of office products and services the Company is exposed to risks associated with changes in foreign currency exchange rates, fuel and
other commodity prices and interest rates. Depending on the exposure, settlement timeframe and other factors, the Company may enter into derivative
transactions to mitigate those risks. Financial instruments authorized under the Company’s established risk management policy include spot trades, swaps,
options, caps, collars, forwards and futures. Use of derivative financial instruments for speculative purposes is expressly prohibited. The Company may
designate and account for such qualifying arrangements as hedges. As of December 27, 2014, the foreign exchange contracts extend through March 2015 and
fuel contracts extended through January 2016.
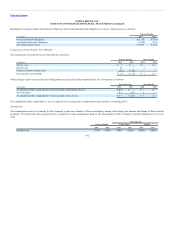
The fair values of the Company’s foreign currency contracts and fuel contracts are the amounts receivable or payable to terminate the agreements at the
reporting date, taking into account current interest rates, exchange rates and commodity prices. The values are based on market-based inputs or unobservable
inputs that are corroborated by market data. At December 27, 2014, Accrued expenses and other liabilities in the Consolidated Balance Sheet includes $6
million related to derivative fuel contracts payable.
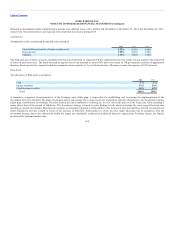
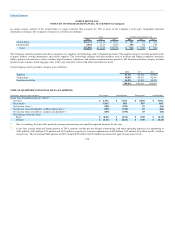
The following table presents information about financial instruments at the balance sheet dates indicated.
(In millions)
Financial assets:
Timber notes receivables $ 945 $933
Boise investment 46 47
Financial liabilities:
Recourse debt:
9.75% Senior Secured Notes 250 290
7.35% debentures, due 2016 18 19
Revenue bonds, due in varying amounts periodically through 2029 186 186
American & Foreign Power Company, Inc. 5% debentures, due 2030 13 13
Non-recourse debt 859 851
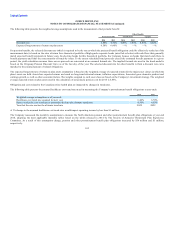
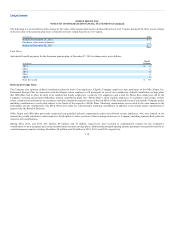
The following methods and assumptions were used to estimate the fair value of each class of financial instruments:
• Fair value is determined as the present value of expected future cash flows discounted at the current interest rate for
loans of similar terms with comparable credit risk (Level 2 measure).
• Fair value at December 28, 2013 was calculated as the sum of the market value of the Company’s indirect investment in Boise
Cascade, the primary investment of Boise Cascade Holdings, plus the Company’s portion of any cash held by Boise Cascade Holdings as of the
balance sheet date (together, Level 2 measure). The Company’s indirect investment in Boise Cascade was calculated using the number of shares
the Company indirectly held in Boise Cascade multiplied by its closing stock price as of the last trading day prior to the balance sheet date. The
investment in Boise Cascade Holdings was fully disposed of in 2014. Refer to Note 6 for further details.
112