Nokia 2008 Annual Report Download - page 89
Download and view the complete annual report
Please find page 89 of the 2008 Nokia annual report below. You can navigate through the pages in the report by either clicking on the pages listed below, or by using the keyword search tool below to find specific information within the annual report.-
 1
1 -
2
-
3
-
4
-
5
-
6
-
7
-
8
-
9
-
10
-
11
-
12
-
13
-
14
-
15
-
16
-
17
-
18
-
19
-
20
-
21
-
22
-
23
-
24
-
25
-
26
-
27
-
28
-
29
-
30
-
31
-
32
-
33
-
34
-
35
-
36
-
37
-
38
-
39
-
40
-
41
-
42
-
43
-
44
-
45
-
46
-
47
-
48
-
49
-
50
-
51
-
52
-
53
-
54
-
55
-
56
-
57
-
58
-
59
-
60
-
61
-
62
-
63
-
64
-
65
-
66
-
67
-
68
-
69
-
70
-
71
-
72
-
73
-
74
-
75
-
76
-
77
-
78
-
 79
79 -
 80
80 -
 81
81 -
 82
82 -
 83
83 -
 84
84 -
 85
85 -
 86
86 -
 87
87 -
 88
88 -
 89
89 -
 90
90 -
 91
91 -
 92
92 -
 93
93 -
 94
94 -
 95
95 -
 96
96 -
 97
97 -
 98
98 -
 99
99 -
100
-
101
-
102
-
103
-
104
-
105
-
106
-
107
-
108
-
109
-
110
-
111
-
112
-
113
-
114
-
115
-
116
-
117
-
118
-
119
-
120
-
121
-
122
-
123
-
124
-
125
-
126
-
127
-
128
-
129
-
130
-
131
-
132
-
133
-
134
-
135
-
136
-
137
-
138
-
139
-
140
-
141
-
142
-
143
-
144
-
145
-
146
-
147
-
148
-
149
-
150
-
151
-
152
-
153
-
154
-
155
-
156
-
157
-
158
-
159
-
160
-
161
-
162
-
163
-
164
-
165
-
166
-
167
-
168
-
169
-
170
-
171
-
172
-
173
-
174
-
175
-
176
-
177
-
178
-
179
-
180
-
181
-
182
-
183
-
184
-
185
-
186
-
187
-
188
-
189
-
190
-
191
-
192
-
193
-
194
-
195
-
196
-
197
-
198
-
199
-
200
-
201
-
202
-
203
-
204
-
205
-
206
-
207
-
208
-
209
-
210
-
211
-
212
-
213
-
214
-
215
-
216
-
217
-
218
-
219
-
220
-
221
-
222
-
223
-
224
-
225
-
226
-
227
 |
 |

We expect our structured financing commitments to be financed mainly through the capital markets
as well as through cash flow from operations.
The structured financing commitments are available under loan facilities mainly negotiated with
customers of Nokia Siemens Networks. Availability of the amounts is dependent upon the borrowers’
continuing compliance with stated financial and operational covenants and compliance with other
administrative terms of the facilities. The customer loans are available to fund capital expenditure
relating to purchase of network infrastructure equipment and services from Nokia Siemens Networks.
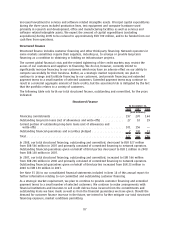
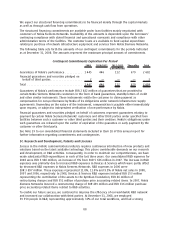
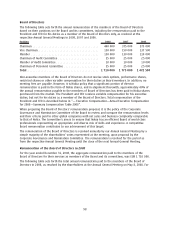
The following table sets forth the amounts of our contingent commitments for the periods indicated
as at December 31, 2008. The amounts represent the maximum principal amount of commitments.
Contingent Commitments Expiration Per Period
2009 20102011 20122013 Thereafter Total
(EUR millions)
Guarantees of Nokia’s performance ........... 1445 446 112 679 2682
Financial guarantees and securities pledged on
behalf of third parties .................... 2 — — — 2
Total ................................... 1447 446 112 679 2684
Guarantees of Nokia’s performance include EUR 2 682 million of guarantees that are provided to
certain Nokia Siemens Networks customers in the form of bank guarantees, standby letters of credit
and other similar instruments. These instruments entitle the customer to claim payment as
compensation for nonperformance by Nokia of its obligations under network infrastructure supply
agreements. Depending on the nature of the instrument, compensation is payable either immediately
upon request, or subject to independent verification of nonperformance by Nokia.
Financial guarantees and securities pledged on behalf of customers represent guarantees relating to
payment by certain Nokia Siemens Networks’ customers and other third parties under specified loan
facilities between such a customer or other third parties and their creditors. Nokia’s obligations under
such guarantees are released upon the earlier of expiration of the guarantee or early payment by the
customer or other third party.
See Note 29 to our consolidated financial statements included in Item 18 of this annual report for
further information regarding commitments and contingencies.
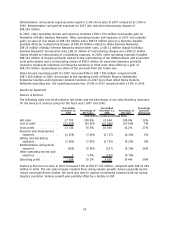
5C. Research and Development, Patents and Licenses
Success in the mobile communications industry requires continuous introduction of new products and
solutions based on the latest available technology. This places considerable demands on our research
and development, or R&D activities. Consequently, in order to maintain our competitiveness, we have
made substantial R&D expenditures in each of the last three years. Our consolidated R&D expenses for
2008 were EUR 5 968 million, an increase of 6% from EUR 5 636 million in 2007. The increase in R&D
expenses was primarily due to increased R&D expenses in Devices & Services which were partly offset
by decreased R&D expenses in Nokia Siemens Networks. R&D expenses in 2006 were
EUR 3 897 million. These expenses represented 11.8%, 11.0% and 9.5% of Nokia net sales in 2008,
2007 and 2006, respectively. In 2008, Devices & Services R&D expenses included EUR 153 million
representing the contribution of the assets to the Symbian Foundation, EUR 46 million of
restructuring charges and EUR 351 million of purchase price accounting related items. In 2007, Nokia
Siemens Networks incurred a restructuring charge of EUR 439 million and EUR 136 million purchase
price accounting related items related to R&D activities.
To enable our future success, we continued to improve the efficiency of our worldwide R&D network
and increased our collaboration with third parties. At December 31, 2008, we employed
39 350 people in R&D, representing approximately 31% of our total workforce, and had a strong
88