Nokia 2008 Annual Report Download - page 82
Download and view the complete annual report
Please find page 82 of the 2008 Nokia annual report below. You can navigate through the pages in the report by either clicking on the pages listed below, or by using the keyword search tool below to find specific information within the annual report.-
 1
1 -
2
-
3
-
4
-
5
-
6
-
7
-
8
-
9
-
10
-
11
-
12
-
13
-
14
-
15
-
16
-
17
-
18
-
19
-
20
-
21
-
22
-
23
-
24
-
25
-
26
-
27
-
28
-
29
-
30
-
31
-
32
-
33
-
34
-
35
-
36
-
37
-
38
-
39
-
40
-
41
-
42
-
43
-
44
-
45
-
46
-
47
-
48
-
49
-
50
-
51
-
52
-
53
-
54
-
55
-
56
-
57
-
58
-
59
-
60
-
61
-
62
-
63
-
64
-
65
-
66
-
67
-
68
-
69
-
70
-
71
-
 72
72 -
 73
73 -
 74
74 -
 75
75 -
 76
76 -
 77
77 -
 78
78 -
 79
79 -
 80
80 -
 81
81 -
 82
82 -
 83
83 -
 84
84 -
 85
85 -
 86
86 -
 87
87 -
 88
88 -
 89
89 -
 90
90 -
 91
91 -
 92
92 -
93
-
94
-
95
-
96
-
97
-
98
-
99
-
100
-
101
-
102
-
103
-
104
-
105
-
106
-
107
-
108
-
109
-
110
-
111
-
112
-
113
-
114
-
115
-
116
-
117
-
118
-
119
-
120
-
121
-
122
-
123
-
124
-
125
-
126
-
127
-
128
-
129
-
130
-
131
-
132
-
133
-
134
-
135
-
136
-
137
-
138
-
139
-
140
-
141
-
142
-
143
-
144
-
145
-
146
-
147
-
148
-
149
-
150
-
151
-
152
-
153
-
154
-
155
-
156
-
157
-
158
-
159
-
160
-
161
-
162
-
163
-
164
-
165
-
166
-
167
-
168
-
169
-
170
-
171
-
172
-
173
-
174
-
175
-
176
-
177
-
178
-
179
-
180
-
181
-
182
-
183
-
184
-
185
-
186
-
187
-
188
-
189
-
190
-
191
-
192
-
193
-
194
-
195
-
196
-
197
-
198
-
199
-
200
-
201
-
202
-
203
-
204
-
205
-
206
-
207
-
208
-
209
-
210
-
211
-
212
-
213
-
214
-
215
-
216
-
217
-
218
-
219
-
220
-
221
-
222
-
223
-
224
-
225
-
226
-
227
 |
 |

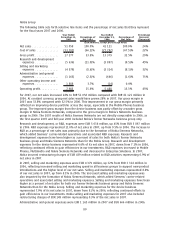
Administrative and general expenses were equal to 2.3% of net sales in 2007 compared to 1.6% in
2006. Administrative and general expenses for 2007 also included restructuring charges of
EUR 146 million.
In 2007, other operating income and expenses included a EUR 1 879 million nontaxable gain on
formation of Nokia Siemens Networks. Other operating income and expenses in 2007 also included
gains on sales of real estate of EUR 128 million and a EUR 53 million gain on a business transfer
partially offset by restructuring charges of EUR 58 million related to Nokia Siemens Networks,
EUR 23 million of Nokia Siemens Networks related other costs, a EUR 12 million charge for Nokia
Siemens Networks’ incremental costs, EUR 32 million of restructuring charges and a EUR 25 million
charge related to restructuring of a subsidiary company. In 2006, other operating expenses included
EUR 142 million of charges primarily related to the restructuring of the CDMA business and associated
asset writedowns and a restructuring charge of EUR 8 million for personnel expenses primarily
related to headcount reductions in Enterprise Solutions in 2006 more than offset by a gain of
EUR 276 million representing our share of the proceeds from the Telsim sale.
Nokia Group’s operating profit for 2007 increased 45% to EUR 7 985 million compared with
EUR 5 488 million in 2006. An increase in the operating profit of Mobile Phones, Multimedia,
Enterprise Solution and Corporate Common Functions in 2007 more than offset Nokia Siemens
Networks operating loss. Our operating margin was 15.6% in 2007 compared with 13.3% in 2006.
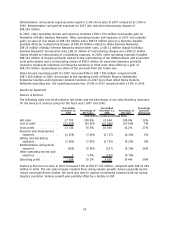
Results by Segments
Devices & Services
The following table sets forth selective line items and the percentage of net sales that they represent
for the Devices & Services group for the fiscal years 2007 and 2006.
Year Ended
December 31,
2007
Percentage of
Net Sales
Year Ended
December 31,
2006
Percentage of
Net Sales
Percentage
Increase/
(Decrease)
(EUR millions, except percentage data)
Net sales ................. 37705 100.0% 33 684 100.0% 12%
Cost of sales .............. (23959) (63.5)% (22 848) (67.8)% 5%
Gross profit ............... 13746 36.5% 10 836 32.2% 27%
Research and development
expenses ............... (2879) (7.6)% (2 717) (8.1)% 6%
Selling and marketing
expenses ............... (2981) (7.9)% (2 770) (8.2)% 8%
Administrative and general
expenses ............... (303) (0.8)% (237) (0.7)% 28%
Other operating income and
expenses ............... 1 0.0% (247) (0.7)%
Operating profit............ 7584 20.1% 4 865 14.4% 56%
Devices & Services net sales in 2007 increased 12% to EUR 37 705 million, compared with EUR 33 684
million in 2006. The net sales increase resulted from strong volume growth, driven especially by the
robust converged device market. We were also able to capture incremental volumes with our strong
logistics execution. Volume growth was partially offset by a decline in ASP.
81