Nokia 2008 Annual Report Download - page 120
Download and view the complete annual report
Please find page 120 of the 2008 Nokia annual report below. You can navigate through the pages in the report by either clicking on the pages listed below, or by using the keyword search tool below to find specific information within the annual report.-
 1
1 -
2
-
3
-
4
-
5
-
6
-
7
-
8
-
9
-
10
-
11
-
12
-
13
-
14
-
15
-
16
-
17
-
18
-
19
-
20
-
21
-
22
-
23
-
24
-
25
-
26
-
27
-
28
-
29
-
30
-
31
-
32
-
33
-
34
-
35
-
36
-
37
-
38
-
39
-
40
-
41
-
42
-
43
-
44
-
45
-
46
-
47
-
48
-
49
-
50
-
51
-
52
-
53
-
54
-
55
-
56
-
57
-
58
-
59
-
60
-
61
-
62
-
63
-
64
-
65
-
66
-
67
-
68
-
69
-
70
-
71
-
72
-
73
-
74
-
75
-
76
-
77
-
78
-
79
-
80
-
81
-
82
-
83
-
84
-
85
-
86
-
87
-
88
-
89
-
90
-
91
-
92
-
93
-
94
-
95
-
96
-
97
-
98
-
99
-
100
-
101
-
102
-
103
-
104
-
105
-
106
-
107
-
108
-
109
-
 110
110 -
 111
111 -
 112
112 -
 113
113 -
 114
114 -
 115
115 -
 116
116 -
 117
117 -
 118
118 -
 119
119 -
 120
120 -
 121
121 -
 122
122 -
 123
123 -
 124
124 -
 125
125 -
 126
126 -
 127
127 -
 128
128 -
 129
129 -
 130
130 -
131
-
132
-
133
-
134
-
135
-
136
-
137
-
138
-
139
-
140
-
141
-
142
-
143
-
144
-
145
-
146
-
147
-
148
-
149
-
150
-
151
-
152
-
153
-
154
-
155
-
156
-
157
-
158
-
159
-
160
-
161
-
162
-
163
-
164
-
165
-
166
-
167
-
168
-
169
-
170
-
171
-
172
-
173
-
174
-
175
-
176
-
177
-
178
-
179
-
180
-
181
-
182
-
183
-
184
-
185
-
186
-
187
-
188
-
189
-
190
-
191
-
192
-
193
-
194
-
195
-
196
-
197
-
198
-
199
-
200
-
201
-
202
-
203
-
204
-
205
-
206
-
207
-
208
-
209
-
210
-
211
-
212
-
213
-
214
-
215
-
216
-
217
-
218
-
219
-
220
-
221
-
222
-
223
-
224
-
225
-
226
-
227
 |
 |

Stock Option
Category
Expiration
Date
Exercise
Price
per
Share
(EUR) Exercisable Unexercisable Exercisable
(3)
Unexercisable
Number of Stock Options
(1)
Total Intrinsic Value of
Stock Options,
December 31, 2008
(EUR)
(2)
Kai O
¨ista
¨mo
¨................. 2003 2Q December 31, 2008 14.95 727 0 0 0
2004 2Q December 31, 2009 11.79 3 125 0 0 0
2005 2Q December 31, 2010 12.79 4 800 2 400 0 0
2005 4Q December 31, 2010 14.48 10 500 8 750 0 0
2006 2Q December 31, 2011 18.02 56 250 43 750 0 0
2007 2Q December 31, 2012 18.39 17 187 37 813 0 0
2008 2Q December 31, 2013 19.16 0 32 000 0 0
Stock options held by the members
of the Group Executive Board on
December 31, 2008, Total . . .... 1577310 1374027 0 0
All outstanding stock option plans
(global plans), Total . . ........ 12244569 10868649 66760 4851
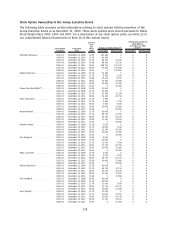
(1)
Number of stock options equals the number of underlying shares represented by the option
entitlement. Stock options vest over four years: 25% after one year and 6.25% each quarter
thereafter.
(2)
The intrinsic value of the stock options is based on the difference between the exercise price of
the options and the closing market price of Nokia shares on NASDAQ OMX Helsinki as at
December 31, 2008 of EUR 11.10.
(3)
For gains realized upon exercise of stock options for the members of the Group Executive Board,
see the table in “—Stock Option Exercises and Settlement of Shares” below.
(4)
From April 1, 2007, Mr. BeresfordWylie has participated in a longterm cash incentive plan
sponsored by Nokia Siemens Networks, instead of the longterm equitybased plans of Nokia.
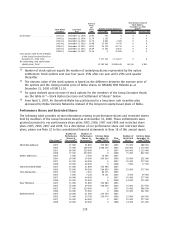
Performance Shares and Restricted Shares
The following table provides certain information relating to performance shares and restricted shares
held by members of the Group Executive Board as at December 31, 2008. These entitlements were
granted pursuant to our performance share plans 2005, 2006, 2007 and 2008 and restricted share
plans 2005, 2006, 2007 and 2008. For a description of our performance share and restricted share
plans, please see Note 22 to the consolidated financial statements in Item 18 of this annual report.
Plan Name
(1)
Number of
Performance
Shares at
Threshold
(2)
Number of
Performance
Shares at
Maximum
(2)
Intrinsic Value
December 31,
2008
(3)
(EUR)
Plan
Name
(4)
Number of
Restricted
Shares
Intrinsic Value
December 31,
2008
(5)
(EUR)
OlliPekka Kallasvuo 2005 15 000 31 800 352 980 2005 35 000 388 500
2006 75 000 148 500 1 648 350 2006 100 000 1 110 000
2007 80 000 320 000 0 2007 100 000 1 110 000
2008 57 500 230 000 0 2008 75 000 832 500
Robert Andersson ........ 2005 3 000 6 360 70 596 2005
2006 20 000 39 600 439 560 2006 20 000 222 000
2007 16 000 64 000 0 2007 25 000 277 500
2008 10 000 40 000 0 2008 7 000 77 700
Simon BeresfordWylie .... 2005 15 000 31 800 352 980 2005
2006 25 000 49 500 549 450 2006 25 000 277 500
Timo Ihamuotila......... 2005 3 600 7 632 84 715 2005
2006 3 600 7 128 79 121 2006 4 500 49 950
2007 16 000 64 000 0 2007 25 000 277 500
2008 10 000 40 000 0 2008 14 000 155 400
Mary McDowell .......... 2005 15 000 31 800 352 980 2005
2006 25 000 49 500 549 450 2006 25 000 277 500
2007 27 500 110 000 0 2007 35 000 388 500
2008 14 000 56 000 0 2008 20 000 222 000
Hallstein Moerk ......... 2005 10 000 21 200 235 320 2005
2006 15 000 29 700 329 670 2006 15 000 166 500
2007 16 000 64 000 0 2007 25 000 277 500
2008 10 000 40 000 0 2008 14 000 155 400
119