Nokia 2008 Annual Report Download - page 170
Download and view the complete annual report
Please find page 170 of the 2008 Nokia annual report below. You can navigate through the pages in the report by either clicking on the pages listed below, or by using the keyword search tool below to find specific information within the annual report.-
 1
1 -
2
-
3
-
4
-
5
-
6
-
7
-
8
-
9
-
10
-
11
-
12
-
13
-
14
-
15
-
16
-
17
-
18
-
19
-
20
-
21
-
22
-
23
-
24
-
25
-
26
-
27
-
28
-
29
-
30
-
31
-
32
-
33
-
34
-
35
-
36
-
37
-
38
-
39
-
40
-
41
-
42
-
43
-
44
-
45
-
46
-
47
-
48
-
49
-
50
-
51
-
52
-
53
-
54
-
55
-
56
-
57
-
58
-
59
-
60
-
61
-
62
-
63
-
64
-
65
-
66
-
67
-
68
-
69
-
70
-
71
-
72
-
73
-
74
-
75
-
76
-
77
-
78
-
79
-
80
-
81
-
82
-
83
-
84
-
85
-
86
-
87
-
88
-
89
-
90
-
91
-
92
-
93
-
94
-
95
-
96
-
97
-
98
-
99
-
100
-
101
-
102
-
103
-
104
-
105
-
106
-
107
-
108
-
109
-
110
-
111
-
112
-
113
-
114
-
115
-
116
-
117
-
118
-
119
-
120
-
121
-
122
-
123
-
124
-
125
-
126
-
127
-
128
-
129
-
130
-
131
-
132
-
133
-
134
-
135
-
136
-
137
-
138
-
139
-
140
-
141
-
142
-
143
-
144
-
145
-
146
-
147
-
148
-
149
-
150
-
151
-
152
-
153
-
154
-
155
-
156
-
157
-
158
-
159
-
 160
160 -
 161
161 -
 162
162 -
 163
163 -
 164
164 -
 165
165 -
 166
166 -
 167
167 -
 168
168 -
 169
169 -
 170
170 -
 171
171 -
 172
172 -
 173
173 -
 174
174 -
 175
175 -
 176
176 -
 177
177 -
 178
178 -
 179
179 -
 180
180 -
181
-
182
-
183
-
184
-
185
-
186
-
187
-
188
-
189
-
190
-
191
-
192
-
193
-
194
-
195
-
196
-
197
-
198
-
199
-
200
-
201
-
202
-
203
-
204
-
205
-
206
-
207
-
208
-
209
-
210
-
211
-
212
-
213
-
214
-
215
-
216
-
217
-
218
-
219
-
220
-
221
-
222
-
223
-
224
-
225
-
226
-
227
 |
 |

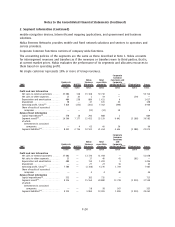
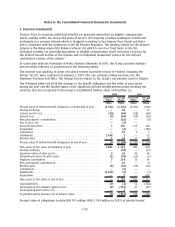
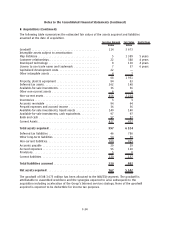
2. Segment information (Continued)
Net sales to external customers by geographic area by location of customer 2008 2007 2006
EURm EURm EURm
Finland .................................................. 362 322 387
China ................................................... 5 916 5 898 4 913
India.................................................... 3 719 3 684 2 713
Great Britain ............................................. 2 382 2 574 2 425
Germany................................................. 2 294 2 641 2 060
Russia................................................... 2 083 2 012 1 518
Indonesia ................................................ 2 046 1 754 1 069
USA..................................................... 1 907 2 124 2 815
Other ................................................... 30 001 30 049 23 221
Total .................................................... 50 710 51 058 41 121
Segment noncurrent assets by geographic area
(7)
2008 2007
EURm EURm
Finland . . ................................................ 1 154 1 114
China.................................................... 434 364
India .................................................... 154 134
Great Britain .............................................. 668 160
Germany . ................................................ 306 465
USA..................................................... 7 037 523
Other.................................................... 2 751 3 272
Total .................................................... 12 504 6 032
(7)
Comprises intangible assets and property, plant and equipment.
3. Percentage of completion
Contract sales recognized under percentage of completion accounting were EUR 11 750 million in
2008 (EUR 10 171 million in 2007 and EUR 6 308 million in 2006).
Advances received related to construction contracts, included under accrued expenses, were
EUR 261 million at December 31, 2008 (EUR 303 million in 2007). Contract revenues recorded prior to
billings, included in accounts receivable, were EUR 1 423 million at December 31, 2008
(EUR 1 587 million in 2007). Billing in excess of costs incurred, included in contract revenues recorded
prior to billings, were EUR 677 million at December 31, 2008 (EUR 482 million in 2007).
The aggregate amount of costs incurred and recognized profits (net of recognized losses) under open
construction contracts in progress since inception (for contracts acquired inception refers to
April 1, 2007) was EUR 11 707 million at December 31, 2008 (EUR 10 173 million at December 31,
2007).
Retentions related to construction contracts, included in accounts receivable, were EUR 211 million at
December 31, 2008 (EUR 166 million at December 31, 2007).
F26
Notes to the Consolidated Financial Statements (Continued)