Nokia 2008 Annual Report Download - page 79
Download and view the complete annual report
Please find page 79 of the 2008 Nokia annual report below. You can navigate through the pages in the report by either clicking on the pages listed below, or by using the keyword search tool below to find specific information within the annual report.-
 1
1 -
2
-
3
-
4
-
5
-
6
-
7
-
8
-
9
-
10
-
11
-
12
-
13
-
14
-
15
-
16
-
17
-
18
-
19
-
20
-
21
-
22
-
23
-
24
-
25
-
26
-
27
-
28
-
29
-
30
-
31
-
32
-
33
-
34
-
35
-
36
-
37
-
38
-
39
-
40
-
41
-
42
-
43
-
44
-
45
-
46
-
47
-
48
-
49
-
50
-
51
-
52
-
53
-
54
-
55
-
56
-
57
-
58
-
59
-
60
-
61
-
62
-
63
-
64
-
65
-
66
-
67
-
68
-
 69
69 -
 70
70 -
 71
71 -
 72
72 -
 73
73 -
 74
74 -
 75
75 -
 76
76 -
 77
77 -
 78
78 -
 79
79 -
 80
80 -
 81
81 -
 82
82 -
 83
83 -
 84
84 -
 85
85 -
 86
86 -
 87
87 -
 88
88 -
 89
89 -
90
-
91
-
92
-
93
-
94
-
95
-
96
-
97
-
98
-
99
-
100
-
101
-
102
-
103
-
104
-
105
-
106
-
107
-
108
-
109
-
110
-
111
-
112
-
113
-
114
-
115
-
116
-
117
-
118
-
119
-
120
-
121
-
122
-
123
-
124
-
125
-
126
-
127
-
128
-
129
-
130
-
131
-
132
-
133
-
134
-
135
-
136
-
137
-
138
-
139
-
140
-
141
-
142
-
143
-
144
-
145
-
146
-
147
-
148
-
149
-
150
-
151
-
152
-
153
-
154
-
155
-
156
-
157
-
158
-
159
-
160
-
161
-
162
-
163
-
164
-
165
-
166
-
167
-
168
-
169
-
170
-
171
-
172
-
173
-
174
-
175
-
176
-
177
-
178
-
179
-
180
-
181
-
182
-
183
-
184
-
185
-
186
-
187
-
188
-
189
-
190
-
191
-
192
-
193
-
194
-
195
-
196
-
197
-
198
-
199
-
200
-
201
-
202
-
203
-
204
-
205
-
206
-
207
-
208
-
209
-
210
-
211
-
212
-
213
-
214
-
215
-
216
-
217
-
218
-
219
-
220
-
221
-
222
-
223
-
224
-
225
-
226
-
227
 |
 |

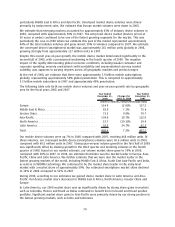
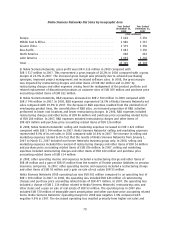
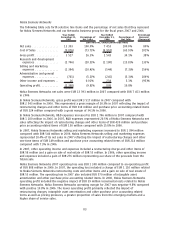
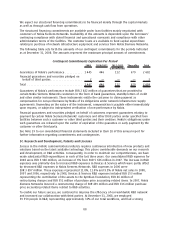
Nokia Siemens Networks Net Sales by Geographic Area
Year Ended
December 31,
2008
Year Ended
December 31,
2007
(EUR millions)
Europe ...................................................... 5618 5359
Middle East & Africa............................................ 2040 1515
Greater China ................................................. 1379 1350
AsiaPacific................................................... 3881 3350
North America ................................................ 698 616
Latin America ................................................ 1693 1202
Total........................................................ 15309 13393
In Nokia Siemens Networks, gross profit was EUR 4 316 million in 2008 compared with
EUR 3 517 million in 2007. This represented a gross margin of 28.2% in 2008 compared with a gross
margin of 26.3% in 2007. The increased gross margin was primarily due to achieved purchasing
synergies, improved project management and increased software sales. In 2008, the gross margin
was impacted by restructuring charges and other items of EUR 402 million and in 2007 by
restructuring charges and other expenses arising from the realignment of the product portfolio and
related replacement of discontinued products at customer sites of EUR 309 million and purchase price
accounting related items of EUR 182 million.
In Nokia Siemens Networks, R&D expenses decreased to EUR 2 500 million in 2008 compared with
EUR 2 746 million in 2007. In 2008, R&D expenses represented 16.3% of Nokia Siemens Networks net
sales compared with 20.5% in 2007. The decrease in R&D expenses resulted from the elimination of
overlapping product lines, the consolidation of R&D sites, an increased proportion of R&D activities
performed in lower cost locations and lower restructuring charges. In 2008, R&D expenses included
restructuring charges and other items of EUR 46 million and purchase price accounting related items
of EUR 180 million. In 2007, R&D expenses included restructuring charges and other items of
EUR 439 million and purchase price accounting related items of EUR 136 million.
In 2008, Nokia Siemens Networks’ selling and marketing expenses increased to EUR 1 421 million
compared with EUR 1 394 million in 2007. Nokia Siemens Networks’ selling and marketing expenses
represented 9.3% of its net sales in 2008 compared with 10.4% in 2007. The increase in selling and
marketing expenses related to the fact that the results of Nokia Siemens Networks from January 1,
2007 to March 31, 2007 included our former Networks business group only. In 2008, selling and
marketing expenses included the reversal of restructuring charges and other items of EUR 14 million
and purchase price accounting related items of EUR 286 million. In 2007, selling and marketing
expenses included restructuring charges and other items of EUR 149 million and purchase price
accounting related items of EUR 214 million.
In 2008, other operating income and expenses included a restructuring charge and other items of
EUR 49 million and a gain of EUR 65 million from the transfer of Finnish pension liabilities to pension
insurance companies. In 2007, other operating income and expenses included a restructuring charge
and other items of EUR 58 million and a gain on sale of real estate EUR 53 million.
Nokia Siemens Networks 2008 operating loss was EUR 301 million compared to an operating loss of
EUR 1 308 million in 2007. In 2008, the operating loss included EUR 646 million of restructuring
charges and purchase price accounting related items of EUR 477 million. In 2007, the operating loss
included a charge of EUR 1 110 million related to Nokia Siemens Networks’ restructuring costs and
other items and a gain on sale of real estate of EUR 53 million. The operating loss in 2007 also
included EUR 570 million of intangible asset amortization and other purchase price accounting related
items. Nokia Siemens Networks’ operating margin for 2008 was negative 2.0% compared with
negative 9.8% in 2007. The decreased operating loss resulted primarily from higher net sales and
78