Nokia 2008 Annual Report Download - page 219
Download and view the complete annual report
Please find page 219 of the 2008 Nokia annual report below. You can navigate through the pages in the report by either clicking on the pages listed below, or by using the keyword search tool below to find specific information within the annual report.-
 1
1 -
2
-
3
-
4
-
5
-
6
-
7
-
8
-
9
-
10
-
11
-
12
-
13
-
14
-
15
-
16
-
17
-
18
-
19
-
20
-
21
-
22
-
23
-
24
-
25
-
26
-
27
-
28
-
29
-
30
-
31
-
32
-
33
-
34
-
35
-
36
-
37
-
38
-
39
-
40
-
41
-
42
-
43
-
44
-
45
-
46
-
47
-
48
-
49
-
50
-
51
-
52
-
53
-
54
-
55
-
56
-
57
-
58
-
59
-
60
-
61
-
62
-
63
-
64
-
65
-
66
-
67
-
68
-
69
-
70
-
71
-
72
-
73
-
74
-
75
-
76
-
77
-
78
-
79
-
80
-
81
-
82
-
83
-
84
-
85
-
86
-
87
-
88
-
89
-
90
-
91
-
92
-
93
-
94
-
95
-
96
-
97
-
98
-
99
-
100
-
101
-
102
-
103
-
104
-
105
-
106
-
107
-
108
-
109
-
110
-
111
-
112
-
113
-
114
-
115
-
116
-
117
-
118
-
119
-
120
-
121
-
122
-
123
-
124
-
125
-
126
-
127
-
128
-
129
-
130
-
131
-
132
-
133
-
134
-
135
-
136
-
137
-
138
-
139
-
140
-
141
-
142
-
143
-
144
-
145
-
146
-
147
-
148
-
149
-
150
-
151
-
152
-
153
-
154
-
155
-
156
-
157
-
158
-
159
-
160
-
161
-
162
-
163
-
164
-
165
-
166
-
167
-
168
-
169
-
170
-
171
-
172
-
173
-
174
-
175
-
176
-
177
-
178
-
179
-
180
-
181
-
182
-
183
-
184
-
185
-
186
-
187
-
188
-
189
-
190
-
191
-
192
-
193
-
194
-
195
-
196
-
197
-
198
-
199
-
200
-
201
-
202
-
203
-
204
-
205
-
206
-
207
-
208
-
 209
209 -
 210
210 -
 211
211 -
 212
212 -
 213
213 -
 214
214 -
 215
215 -
 216
216 -
 217
217 -
 218
218 -
 219
219 -
 220
220 -
 221
221 -
 222
222 -
 223
223 -
 224
224 -
 225
225 -
 226
226 -
 227
227
 |
 |

35. Risk Management (Continued)
Nokia is exposed to equity price risk on social security costs relating to its equity compensation plans.
Nokia mitigates this risk by entering into cash settled equity option contracts.
ValueatRisk
Nokia uses the ValueatRisk (“VaR”) methodology to assess the Group exposures to foreign exchange
(“FX”), interest rate, and equity risks. The VaR gives estimates of potential fair value losses in market
risk sensitive instruments as a result of adverse changes in specified market factors, at a specified
confidence level over a defined holding period.
In Nokia the FX VaR is calculated with the Monte Carlo method which simulates random values for
exchange rates in which the Group has exposures and takes the nonlinear price function of certain FX
derivative instruments into account. The variancecovariance methodology is used to assess and
measure the interest rate risk and equity price risk.
The VaR is determined by using volatilities and correlations of rates and prices estimated from a one
year sample of historical market data, at 95% confidence level, using a onemonth holding period. To
put more weight on recent market conditions, an exponentially weighted moving average is
performed on the data with an appropriate decay factor.
This model implies that within a onemonth period, the potential loss will not exceed the VaR
estimate in 95% of possible outcomes. In the remaining 5% of possible outcomes, the potential loss
will be at minimum equal to the VaR figure, and on average substantially higher.
The VaR methodology relies on a number of assumptions, such as, a) risks are measured under
average market conditions, assuming that market risk factors follow normal distributions; b) future
movements in market risk factors follow estimated historical movements; c) the assessed exposures
do not change during the holding period. Thus it is possible that, for any given month, the potential
losses at 95% confidence level are different and could be substantially higher than the estimated VaR.
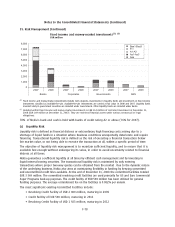
FX Risk
The VaR figures for the Group’s financial instruments which are sensitive to foreign exchange risks are
presented in Table 1 below. As defined under IFRS 7, the financial instruments included in the VaR
calculation are:
• FX exposures from outstanding balance sheet items and other FX derivatives carried at fair value
through profit and loss which are not in a hedge relationship and are mostly used for hedging
balance sheet FX exposure.
• FX derivatives designated as forecasted cashflow hedges and net investment hedges. Most of the
VaR is caused by these derivatives as forecasted cashflow and net investment exposures are not
financial instruments as defined under IFRS 7 and thus not included in the VaR calculation.
Table 1 Foreign exchange position ValueatRisk
2008 2007
VaR from financial
instruments
EURm EURm
At December 31 ..................................................... 442 246
Average for the year .................................................. 337 96
Range for the year ................................................... 191730 57246
F75
Notes to the Consolidated Financial Statements (Continued)