Nokia 2008 Annual Report Download - page 221
Download and view the complete annual report
Please find page 221 of the 2008 Nokia annual report below. You can navigate through the pages in the report by either clicking on the pages listed below, or by using the keyword search tool below to find specific information within the annual report.-
 1
1 -
2
-
3
-
4
-
5
-
6
-
7
-
8
-
9
-
10
-
11
-
12
-
13
-
14
-
15
-
16
-
17
-
18
-
19
-
20
-
21
-
22
-
23
-
24
-
25
-
26
-
27
-
28
-
29
-
30
-
31
-
32
-
33
-
34
-
35
-
36
-
37
-
38
-
39
-
40
-
41
-
42
-
43
-
44
-
45
-
46
-
47
-
48
-
49
-
50
-
51
-
52
-
53
-
54
-
55
-
56
-
57
-
58
-
59
-
60
-
61
-
62
-
63
-
64
-
65
-
66
-
67
-
68
-
69
-
70
-
71
-
72
-
73
-
74
-
75
-
76
-
77
-
78
-
79
-
80
-
81
-
82
-
83
-
84
-
85
-
86
-
87
-
88
-
89
-
90
-
91
-
92
-
93
-
94
-
95
-
96
-
97
-
98
-
99
-
100
-
101
-
102
-
103
-
104
-
105
-
106
-
107
-
108
-
109
-
110
-
111
-
112
-
113
-
114
-
115
-
116
-
117
-
118
-
119
-
120
-
121
-
122
-
123
-
124
-
125
-
126
-
127
-
128
-
129
-
130
-
131
-
132
-
133
-
134
-
135
-
136
-
137
-
138
-
139
-
140
-
141
-
142
-
143
-
144
-
145
-
146
-
147
-
148
-
149
-
150
-
151
-
152
-
153
-
154
-
155
-
156
-
157
-
158
-
159
-
160
-
161
-
162
-
163
-
164
-
165
-
166
-
167
-
168
-
169
-
170
-
171
-
172
-
173
-
174
-
175
-
176
-
177
-
178
-
179
-
180
-
181
-
182
-
183
-
184
-
185
-
186
-
187
-
188
-
189
-
190
-
191
-
192
-
193
-
194
-
195
-
196
-
197
-
198
-
199
-
200
-
201
-
202
-
203
-
204
-
205
-
206
-
207
-
208
-
209
-
210
-
 211
211 -
 212
212 -
 213
213 -
 214
214 -
 215
215 -
 216
216 -
 217
217 -
 218
218 -
 219
219 -
 220
220 -
 221
221 -
 222
222 -
 223
223 -
 224
224 -
 225
225 -
 226
226 -
 227
227
 |
 |

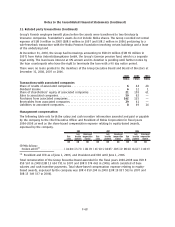
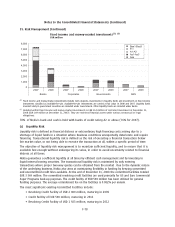
35. Risk Management (Continued)
estimate of incurred losses. All receivables and loans due from customers and other third parties are
considered on an individual basis for impairment testing.
Top three customers account for approximately 4.0%, 3.8% and 3.5% (2007: 4.9%, 2.9% and 2.5%) of
Group accounts receivable and loans due from customers and other third parties as at December 31,
2008 while the top three credit exposures by country amounted to 8.5%, 7.2% and 7.2% (2007: 8.7%,
6.9% and 6.5% ) respectively.
As at December 31, 2008, the carrying amount before deducting any impairment allowance of
accounts receivable relating to customers for which an impairment was provided amounted to
EUR 3 042 million (2007: EUR 3 011 million). The amount of provision taken against that portion of
these receivables considered to be impaired was EUR 415 million (2007: EUR 332 million) (see also
note 19 Valuation and qualifying accounts).
An amount of EUR 729 million (2007: EUR 478 million) relates to past due receivables from customers
for which no impairment loss was recognized. The aging of these receivables is as follows:
2008 2007
EURm EURm
Past due 130 days ....................................................... 453 411
Past due 31180 days ..................................................... 240 66
More than 180 days ....................................................... 36 1
729 478
As at December 31, 2008, the carrying amount before deducting any impairment allowance of loans
due from customers and other third parties for which impairment was provided amounted to
EUR 4 million (2007: EUR 161 million). The amount of provision taken for these loans was
EUR 4 million (2007: EUR 19 million).
There were no past due loans due from customers and other third parties.
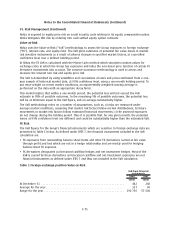
Financial Credit Risk
Financial instruments contain an element of risk of loss resulting from counterparties being unable to
meet their obligations. This risk is measured and monitored centrally. Nokia manages financial credit
risk actively by limiting its counterparties to a sufficient number of major banks and financial
institutions and monitoring the credit worthiness and exposure sizes continuously as well as through
entering into netting arrangements (which gives Nokia the right to offset in the event that the
counterparty would not be able to fulfill the obligations) with all major counterparties and collateral
agreements (which require counterparties to post collateral against derivative receivables) with
certain counterparties.
Nokia’s investment decisions are based on strict creditworthiness and maturity criteria as defined in
the Treasury Policy and Operating Procedure. Due to global banking crisis and the freezing of the
credit markets in 2008, Nokia applied an even more defensive approach than usual within Treasury
Policy towards investments and counterparty quality and maturities, focusing on capital preservation
and liquidity. As result of this investment policy approach and active management of outstanding
investments exposures, Nokia has not been subject to any material credit losses in its financial
investments.
The table below presents the breakdown of the outstanding availableforsale fixed income and
money market investments by sector and credit rating grades ranked as per Moody’s rating
categories.
F77
Notes to the Consolidated Financial Statements (Continued)