Nokia 2008 Annual Report Download - page 186
Download and view the complete annual report
Please find page 186 of the 2008 Nokia annual report below. You can navigate through the pages in the report by either clicking on the pages listed below, or by using the keyword search tool below to find specific information within the annual report.-
 1
1 -
2
-
3
-
4
-
5
-
6
-
7
-
8
-
9
-
10
-
11
-
12
-
13
-
14
-
15
-
16
-
17
-
18
-
19
-
20
-
21
-
22
-
23
-
24
-
25
-
26
-
27
-
28
-
29
-
30
-
31
-
32
-
33
-
34
-
35
-
36
-
37
-
38
-
39
-
40
-
41
-
42
-
43
-
44
-
45
-
46
-
47
-
48
-
49
-
50
-
51
-
52
-
53
-
54
-
55
-
56
-
57
-
58
-
59
-
60
-
61
-
62
-
63
-
64
-
65
-
66
-
67
-
68
-
69
-
70
-
71
-
72
-
73
-
74
-
75
-
76
-
77
-
78
-
79
-
80
-
81
-
82
-
83
-
84
-
85
-
86
-
87
-
88
-
89
-
90
-
91
-
92
-
93
-
94
-
95
-
96
-
97
-
98
-
99
-
100
-
101
-
102
-
103
-
104
-
105
-
106
-
107
-
108
-
109
-
110
-
111
-
112
-
113
-
114
-
115
-
116
-
117
-
118
-
119
-
120
-
121
-
122
-
123
-
124
-
125
-
126
-
127
-
128
-
129
-
130
-
131
-
132
-
133
-
134
-
135
-
136
-
137
-
138
-
139
-
140
-
141
-
142
-
143
-
144
-
145
-
146
-
147
-
148
-
149
-
150
-
151
-
152
-
153
-
154
-
155
-
156
-
157
-
158
-
159
-
160
-
161
-
162
-
163
-
164
-
165
-
166
-
167
-
168
-
169
-
170
-
171
-
172
-
173
-
174
-
175
-
 176
176 -
 177
177 -
 178
178 -
 179
179 -
 180
180 -
 181
181 -
 182
182 -
 183
183 -
 184
184 -
 185
185 -
 186
186 -
 187
187 -
 188
188 -
 189
189 -
 190
190 -
 191
191 -
 192
192 -
 193
193 -
 194
194 -
 195
195 -
 196
196 -
197
-
198
-
199
-
200
-
201
-
202
-
203
-
204
-
205
-
206
-
207
-
208
-
209
-
210
-
211
-
212
-
213
-
214
-
215
-
216
-
217
-
218
-
219
-
220
-
221
-
222
-
223
-
224
-
225
-
226
-
227
 |
 |

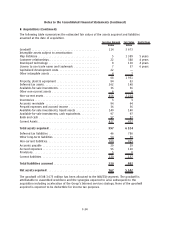
9. Depreciation and amortization
2008 2007 2006
EURm EURm EURm
Depreciation and amortization by function
Cost of sales ..................................................... 297 303 279
Research and development
(1)
........................................ 778 523 312
Selling and marketing
(2)
............................................ 368 232 9
Administrative and general ......................................... 174 148 111
Other operating expenses .......................................... — — 1
Total ........................................................... 1 617 1 206 712
(1)
In 2008, depreciation and amortization allocated to research and development included
amortization of acquired intangible assets of EUR 351 million (EUR 136 million in 2007).
(2)
In 2008, depreciation and amortization allocated to selling and marketing included amortization
of acquired intangible assets of EUR 343 million (EUR 214 million in 2007).
10. Financial income and expenses
2008 2007 2006
EURm EURm EURm
Dividend income on availableforsale financial investments ................. 1——
Interest income on availableforsale financial investments ................. 353 338 225
Interest income on loans receivables carried at amortized cost .............. —1—
Interest expense on financial liabilities carried at amortized cost............. (185) (43) (22)
Other financial income .............................................. 17 43 55
Other financial expenses ............................................. (31) (24) (18)
Net foreign exchange gains (or losses)
From foreign exchange derivatives designated at fair value through profit
and loss account................................................ 432 37 75
From balance sheet items revaluation ................................ (595) (118) (106)
Net gains (net losses) on other derivatives designated at fair value through
profit and loss account ............................................ 65(2)
Total ............................................................. (2) 239 207
During 2008, Nokia’s interest expense increased significantly due to an increase in interestbearing
liabilities mainly related to financing of the NAVTEQ acquisition. Foreign exchange gains (or losses)
increased due to a higher cost of hedging and increased volatility on the foreign exchange market.
11. Income taxes
2008 2007 2006
EURm EURm EURm
Income tax expense
Current tax .......................................... (1 514) (2 209) (1 303)
Deferred tax ......................................... 433 687 (54)
Total ............................................... (1 081) (1 522) (1 357)
Finland.............................................. (604) (1 323) (941)
Other countries ....................................... (477) (199) (416)
Total ............................................... (1 081) (1 522) (1 357)
The differences between income tax expense computed at the statutory rate in Finland of 26% and
F42
Notes to the Consolidated Financial Statements (Continued)