Nokia 2008 Annual Report Download - page 73
Download and view the complete annual report
Please find page 73 of the 2008 Nokia annual report below. You can navigate through the pages in the report by either clicking on the pages listed below, or by using the keyword search tool below to find specific information within the annual report.-
 1
1 -
2
-
3
-
4
-
5
-
6
-
7
-
8
-
9
-
10
-
11
-
12
-
13
-
14
-
15
-
16
-
17
-
18
-
19
-
20
-
21
-
22
-
23
-
24
-
25
-
26
-
27
-
28
-
29
-
30
-
31
-
32
-
33
-
34
-
35
-
36
-
37
-
38
-
39
-
40
-
41
-
42
-
43
-
44
-
45
-
46
-
47
-
48
-
49
-
50
-
51
-
52
-
53
-
54
-
55
-
56
-
57
-
58
-
59
-
60
-
61
-
62
-
 63
63 -
 64
64 -
 65
65 -
 66
66 -
 67
67 -
 68
68 -
 69
69 -
 70
70 -
 71
71 -
 72
72 -
 73
73 -
 74
74 -
 75
75 -
 76
76 -
 77
77 -
 78
78 -
 79
79 -
 80
80 -
 81
81 -
 82
82 -
 83
83 -
84
-
85
-
86
-
87
-
88
-
89
-
90
-
91
-
92
-
93
-
94
-
95
-
96
-
97
-
98
-
99
-
100
-
101
-
102
-
103
-
104
-
105
-
106
-
107
-
108
-
109
-
110
-
111
-
112
-
113
-
114
-
115
-
116
-
117
-
118
-
119
-
120
-
121
-
122
-
123
-
124
-
125
-
126
-
127
-
128
-
129
-
130
-
131
-
132
-
133
-
134
-
135
-
136
-
137
-
138
-
139
-
140
-
141
-
142
-
143
-
144
-
145
-
146
-
147
-
148
-
149
-
150
-
151
-
152
-
153
-
154
-
155
-
156
-
157
-
158
-
159
-
160
-
161
-
162
-
163
-
164
-
165
-
166
-
167
-
168
-
169
-
170
-
171
-
172
-
173
-
174
-
175
-
176
-
177
-
178
-
179
-
180
-
181
-
182
-
183
-
184
-
185
-
186
-
187
-
188
-
189
-
190
-
191
-
192
-
193
-
194
-
195
-
196
-
197
-
198
-
199
-
200
-
201
-
202
-
203
-
204
-
205
-
206
-
207
-
208
-
209
-
210
-
211
-
212
-
213
-
214
-
215
-
216
-
217
-
218
-
219
-
220
-
221
-
222
-
223
-
224
-
225
-
226
-
227
 |
 |

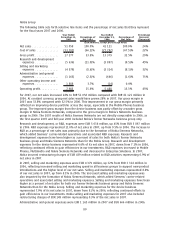
Nokia Group
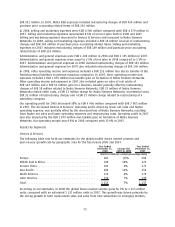
The following table sets forth selective line items and the percentage of net sales that they represent
for the fiscal years 2008 and 2007.
Year Ended
December 31,
2008
Percentage of
Net Sales
Year Ended
December 31,
2007
Percentage of
Net Sales
Percentage
Increase/
(Decrease)
(EUR millions, except percentage data)
Net sales ................. 50710 100.0% 51 058 100.0% (1)%
Cost of sales .............. (33337) (65.7)% (33 781) (66.2)% (1)%
Gross profit ............... 17373 34.3% 17 277 33.8% 1%
Research and development
expenses ............... (5968) (11.8)% (5 636) (11.0)% 6%
Selling and marketing
expenses ............... (4380) (8.6)% (4 379) (8.6)% 0%
Administrative and general
expenses ............... (1284) (2.5)% (1 165) (2.3)% 10%
Other operating income and
expenses ............... (775) (1.5)% 1 888 3.7%
Operating profit............ 4966 9.8% 7 985 15.6% (38)%
For 2008, our net sales decreased 1% to EUR 50 710 million compared with EUR 51 058 million in
2007. At constant currency, group net sales would have grown 4% in 2008. The decrease in net sales
was driven by the decreased net sales in Devices & Services. The following table sets forth the
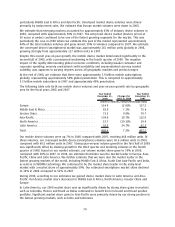
distribution by geographical area of our net sales for the fiscal years 2008 and 2007.
2008 2007
Year Ended
December 31,
Europe .................................................................. 37% 39%
Middle East & Africa ........................................................ 14% 14%
Greater China ............................................................. 13% 12%
AsiaPacific............................................................... 22% 22%
North America ............................................................ 4% 5%
Latin America............................................................. 10% 8%
Total .................................................................... 100% 100%
The 10 markets in which we generated the greatest net sales in 2008 were, in descending order of
magnitude, China, India, the UK, Germany, Russia, Indonesia, the US, Brazil, Italy and Spain, together
representing approximately 50% of our total net sales in 2008. In comparison, the 10 markets in
which we generated the greatest net sales in 2007 were China, India, Germany, the UK, the US,
Russia, Spain, Italy, Indonesia and Brazil, together representing approximately 50% of our total net
sales in 2007.
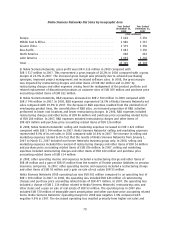
Our gross margin in 2008 was 34.3% compared with 33.8% in 2007. This improvement in our gross
margin reflected an increase in gross margin of Nokia Siemens Networks.
Research and development, or R&D, expenses were EUR 5 968 million, up 6% from EUR 5 636 million
in 2007. R&D expenses represented 11.8% of net sales in 2008, up from 11.0% in 2007. The increase
in R&D as a percentage of net sales reflected increased R&D expenses in Devices & Services which
were partially offset by decreased R&D expenses in Nokia Siemens Networks. In 2008, Nokia R&D
expenses included EUR 153 million representing the contribution of the assets to the Symbian
Foundation, restructuring charges of EUR 46 million and purchase price accounting related items of
72