Nokia 2008 Annual Report Download - page 202
Download and view the complete annual report
Please find page 202 of the 2008 Nokia annual report below. You can navigate through the pages in the report by either clicking on the pages listed below, or by using the keyword search tool below to find specific information within the annual report.-
 1
1 -
2
-
3
-
4
-
5
-
6
-
7
-
8
-
9
-
10
-
11
-
12
-
13
-
14
-
15
-
16
-
17
-
18
-
19
-
20
-
21
-
22
-
23
-
24
-
25
-
26
-
27
-
28
-
29
-
30
-
31
-
32
-
33
-
34
-
35
-
36
-
37
-
38
-
39
-
40
-
41
-
42
-
43
-
44
-
45
-
46
-
47
-
48
-
49
-
50
-
51
-
52
-
53
-
54
-
55
-
56
-
57
-
58
-
59
-
60
-
61
-
62
-
63
-
64
-
65
-
66
-
67
-
68
-
69
-
70
-
71
-
72
-
73
-
74
-
75
-
76
-
77
-
78
-
79
-
80
-
81
-
82
-
83
-
84
-
85
-
86
-
87
-
88
-
89
-
90
-
91
-
92
-
93
-
94
-
95
-
96
-
97
-
98
-
99
-
100
-
101
-
102
-
103
-
104
-
105
-
106
-
107
-
108
-
109
-
110
-
111
-
112
-
113
-
114
-
115
-
116
-
117
-
118
-
119
-
120
-
121
-
122
-
123
-
124
-
125
-
126
-
127
-
128
-
129
-
130
-
131
-
132
-
133
-
134
-
135
-
136
-
137
-
138
-
139
-
140
-
141
-
142
-
143
-
144
-
145
-
146
-
147
-
148
-
149
-
150
-
151
-
152
-
153
-
154
-
155
-
156
-
157
-
158
-
159
-
160
-
161
-
162
-
163
-
164
-
165
-
166
-
167
-
168
-
169
-
170
-
171
-
172
-
173
-
174
-
175
-
176
-
177
-
178
-
179
-
180
-
181
-
182
-
183
-
184
-
185
-
186
-
187
-
188
-
189
-
190
-
191
-
 192
192 -
 193
193 -
 194
194 -
 195
195 -
 196
196 -
 197
197 -
 198
198 -
 199
199 -
 200
200 -
 201
201 -
 202
202 -
 203
203 -
 204
204 -
 205
205 -
 206
206 -
 207
207 -
 208
208 -
 209
209 -
 210
210 -
 211
211 -
 212
212 -
213
-
214
-
215
-
216
-
217
-
218
-
219
-
220
-
221
-
222
-
223
-
224
-
225
-
226
-
227
 |
 |

22. Sharebased payment (Continued)
(2)
Does not include 2 048 outstanding performance shares with deferred delivery due to leave of
absence.
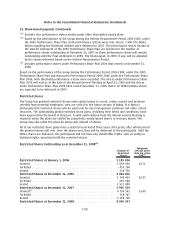
The following table sets forth the performance criteria of each global performance share plan.
Plan EPS
(1)
Average Annual
Net Sales Growth
(1)
EPS
(1)
Average Annual
Net Sales Growth
(1)
Threshold Performance Maximum Performance
EUR EUR
2004 Interim measurement 0.80 4% 0.94 16%
Performance period 0.84 8% 1.18 20%
2005 Interim measurement 0.75 3% 0.96 12%
Performance period 0.82 8% 1.33 17%
2006 Performance period 0.96 11% 1.41 26%
2007 Performance period 1.26 9.5% 1.86 20%
2008 Performance period 1.72 4% 2.76 16%
(1)
Both the EPS and Average Annual Net Sales Growth criteria have an equal weight of 50%.
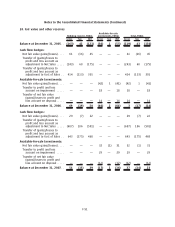
Performance Shares Outstanding as at December 31, 2008
(1)
Number of
performance
shares at
threshold
Weighted
average grant
date fair value
EUR
(2)
Performance shares at January 1, 2006 ......................... 8 042 817
Granted .................................................... 5140736 14.83
Forfeited ................................................... 569164
Performance shares at December 31, 2006
(3)
.................... 12 614 389
Granted .................................................... 2163901 19.96
Forfeited ................................................... 1001332
Vested
(4)
.................................................... 222400
Performance shares at December 31, 2007
(5)
.................... 13 554 558
Granted .................................................... 2463033 13.35
Forfeited ................................................... 690909
Vested
(3)(4)(6)
................................................ 7291463
Performance shares at December 31, 2008 ...................... 8 035 219
(1)
Includes also performance shares granted under other than global equity plans. For further
information see “Other equity plans for employees” below.
(2)
The fair value of performance shares is estimated based on the grant date market price of the
Company’s share less the present value of dividends expected to be paid during the vesting
period.
(3)
Based on the performance of the Group during the Interim Measurement Period 20042005, under
the 2004 Performance Share Plan, both performance criteria were met. Hence, 3 595 339 Nokia
shares equalling the threshold number were delivered in 2006.
The performance shares related to the interim settlement of the 2004 Performance Share Plan are
included in the number of performance shares outstanding at December 31, 2006 as these
performance shares were outstanding until the final settlement in 2008. The final payout, in
2008, was adjusted by the shares delivered based on the Interim Measurement Period.
F58
Notes to the Consolidated Financial Statements (Continued)