Nokia 2008 Annual Report Download - page 75
Download and view the complete annual report
Please find page 75 of the 2008 Nokia annual report below. You can navigate through the pages in the report by either clicking on the pages listed below, or by using the keyword search tool below to find specific information within the annual report.-
 1
1 -
2
-
3
-
4
-
5
-
6
-
7
-
8
-
9
-
10
-
11
-
12
-
13
-
14
-
15
-
16
-
17
-
18
-
19
-
20
-
21
-
22
-
23
-
24
-
25
-
26
-
27
-
28
-
29
-
30
-
31
-
32
-
33
-
34
-
35
-
36
-
37
-
38
-
39
-
40
-
41
-
42
-
43
-
44
-
45
-
46
-
47
-
48
-
49
-
50
-
51
-
52
-
53
-
54
-
55
-
56
-
57
-
58
-
59
-
60
-
61
-
62
-
63
-
64
-
 65
65 -
 66
66 -
 67
67 -
 68
68 -
 69
69 -
 70
70 -
 71
71 -
 72
72 -
 73
73 -
 74
74 -
 75
75 -
 76
76 -
 77
77 -
 78
78 -
 79
79 -
 80
80 -
 81
81 -
 82
82 -
 83
83 -
 84
84 -
 85
85 -
86
-
87
-
88
-
89
-
90
-
91
-
92
-
93
-
94
-
95
-
96
-
97
-
98
-
99
-
100
-
101
-
102
-
103
-
104
-
105
-
106
-
107
-
108
-
109
-
110
-
111
-
112
-
113
-
114
-
115
-
116
-
117
-
118
-
119
-
120
-
121
-
122
-
123
-
124
-
125
-
126
-
127
-
128
-
129
-
130
-
131
-
132
-
133
-
134
-
135
-
136
-
137
-
138
-
139
-
140
-
141
-
142
-
143
-
144
-
145
-
146
-
147
-
148
-
149
-
150
-
151
-
152
-
153
-
154
-
155
-
156
-
157
-
158
-
159
-
160
-
161
-
162
-
163
-
164
-
165
-
166
-
167
-
168
-
169
-
170
-
171
-
172
-
173
-
174
-
175
-
176
-
177
-
178
-
179
-
180
-
181
-
182
-
183
-
184
-
185
-
186
-
187
-
188
-
189
-
190
-
191
-
192
-
193
-
194
-
195
-
196
-
197
-
198
-
199
-
200
-
201
-
202
-
203
-
204
-
205
-
206
-
207
-
208
-
209
-
210
-
211
-
212
-
213
-
214
-
215
-
216
-
217
-
218
-
219
-
220
-
221
-
222
-
223
-
224
-
225
-
226
-
227
 |
 |

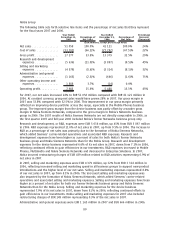
particularly Middle East & Africa and AsiaPacific. Developed market device volumes were driven
primarily by replacement sales. We estimate that Europe market volumes were down in 2008.
We estimate that emerging markets accounted for approximately 63% of industry device volumes in
2008, compared with approximately 59% in 2007. The entrylevel device market (devices priced at
50 euros or under) continued to be one of the fastest growing segments for the market. This was
particularly the case in 2008 where we estimate this part of the market represented approximately
44% of the total industry volumes and grew almost 30% in volumes compared to 2007. We estimate
the converged device (smartphones) market was approximately 161 million units globally in 2008,
growing strongly from approximately 117 million units in 2007.
Despite this overall yearonyear growth, the mobile device market deteriorated significantly in the
second half of 2008, with a pronounced weakening in the fourth quarter of 2008. The negative
impact of the rapidly deteriorating global economic conditions, including weaker consumer and
corporate spending, severely constrained credit availability and unprecedented currency market
volatility, was apparent in varying degrees across all geographic markets and product ranges.
At the end of 2008, we estimate that there were approximately 3.9 billion mobile subscriptions
globally, representing approximately 58% global penetration. This is compared to approximately
3.3 billion mobile subscribers in 2007 and approximately 43% penetration.
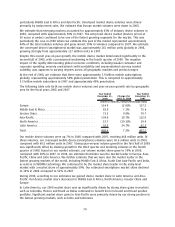
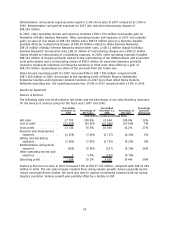
The following table sets forth our mobile device volumes and yearonyear growth rate by geographic
area for the fiscal years 2008 and 2007.
Year Ended
December 31,
2008
Change (%)
2007 to 2008
Year Ended
December 31,
2007
(Units in millions, except percentage data)
Europe .......................................... 114.9 (2.0)% 117.2
Middle East & Africa ................................ 81.0 7.1% 75.6
Greater China ..................................... 71.3 0.8% 70.7
AsiaPacific. . ..................................... 134.0 18.7% 112.9
North America .................................... 15.7 (19.1)% 19.4
Latin America..................................... 51.5 24.7% 41.3
Total ............................................ 468.4 7.2% 437.1
Our mobile device volumes were up 7% in 2008 compared with 2007, reaching 468 million units. Of
those volumes, our converged mobile device (smartphone) volumes were 60.6 million units in 2008,
compared with 60.5 million units in 2007. Strong yearonyear volume growth in the first half of 2008
was significantly offset by slowing growth in the third quarter and declining volumes in the fourth
quarter of 2008. Based on our market estimate, our volume market share grew to 39% in 2008,
compared with 38% in 2007. In 2008, we estimate that Nokia was the market leader in Europe, Asia
Pacific, China and Latin America. We further estimate that we were also the market leader in the
fastest growing markets of the world, including Middle East & Africa, South East AsiaPacific and India,
as well as in WCDMA technology. We continued to be the market share leader in the entrylevel
market with a market share of approximately 50%. Our estimated smartphone market share declined
to 38% in 2008 compared to 52% in 2007.
During 2008, according to our estimates we gained device market share in Latin America and Asia
Pacific. Our device market share decreased in Middle East & Africa, North America, Greater China and
Europe.
In Latin America, our 2008 market share was up significantly driven by strong share gains in markets
such as Colombia, Mexico and Brazil as Nokia continued to benefit from its brand and broad product
portfolio. Significant market share gains in AsiaPacific were primarily driven by our strong position in
the fastest growing markets, such as India and Indonesia.
74