Nokia 2008 Annual Report Download - page 199
Download and view the complete annual report
Please find page 199 of the 2008 Nokia annual report below. You can navigate through the pages in the report by either clicking on the pages listed below, or by using the keyword search tool below to find specific information within the annual report.-
 1
1 -
2
-
3
-
4
-
5
-
6
-
7
-
8
-
9
-
10
-
11
-
12
-
13
-
14
-
15
-
16
-
17
-
18
-
19
-
20
-
21
-
22
-
23
-
24
-
25
-
26
-
27
-
28
-
29
-
30
-
31
-
32
-
33
-
34
-
35
-
36
-
37
-
38
-
39
-
40
-
41
-
42
-
43
-
44
-
45
-
46
-
47
-
48
-
49
-
50
-
51
-
52
-
53
-
54
-
55
-
56
-
57
-
58
-
59
-
60
-
61
-
62
-
63
-
64
-
65
-
66
-
67
-
68
-
69
-
70
-
71
-
72
-
73
-
74
-
75
-
76
-
77
-
78
-
79
-
80
-
81
-
82
-
83
-
84
-
85
-
86
-
87
-
88
-
89
-
90
-
91
-
92
-
93
-
94
-
95
-
96
-
97
-
98
-
99
-
100
-
101
-
102
-
103
-
104
-
105
-
106
-
107
-
108
-
109
-
110
-
111
-
112
-
113
-
114
-
115
-
116
-
117
-
118
-
119
-
120
-
121
-
122
-
123
-
124
-
125
-
126
-
127
-
128
-
129
-
130
-
131
-
132
-
133
-
134
-
135
-
136
-
137
-
138
-
139
-
140
-
141
-
142
-
143
-
144
-
145
-
146
-
147
-
148
-
149
-
150
-
151
-
152
-
153
-
154
-
155
-
156
-
157
-
158
-
159
-
160
-
161
-
162
-
163
-
164
-
165
-
166
-
167
-
168
-
169
-
170
-
171
-
172
-
173
-
174
-
175
-
176
-
177
-
178
-
179
-
180
-
181
-
182
-
183
-
184
-
185
-
186
-
187
-
188
-
 189
189 -
 190
190 -
 191
191 -
 192
192 -
 193
193 -
 194
194 -
 195
195 -
 196
196 -
 197
197 -
 198
198 -
 199
199 -
 200
200 -
 201
201 -
 202
202 -
 203
203 -
 204
204 -
 205
205 -
 206
206 -
 207
207 -
 208
208 -
 209
209 -
210
-
211
-
212
-
213
-
214
-
215
-
216
-
217
-
218
-
219
-
220
-
221
-
222
-
223
-
224
-
225
-
226
-
227
 |
 |

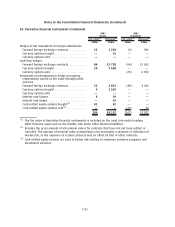
22. Sharebased payment (Continued)
The table below sets forth certain information relating to the stock options outstanding at
December 31, 2008.
Plan
(year of launch)
Stock options
outstanding
2008
Number of
participants
(approx.)
Option (sub)
category
Vesting status
(as percentage of
total number of
stock options
outstanding) First vest date Last vest date Expiry date
Exercise price/
share
EUR
Exercise period
2003
(1)
3 217 206 3 000 2003 2Q Expired July 1, 2004 July 2, 2007 December 31, 2008 14.95
2003 3Q Expired October 1, 2004 October 1, 2007 December 31, 2008 12.71
2003 4Q Expired January 3, 2005 January 2, 2008 December 31, 2008 15.05
2004 2Q 100.00 July 1, 2005 July 1, 2008 December 31, 2009 11.79
2004 3Q 100.00 October 3, 2005 October 1, 2008 December 31, 2009 9.44
2004 4Q 93.75 January 2, 2006 January 2, 2009 December 31, 2009 12.35
2005
(1)
13 277 078 8 000 2005 2Q 81.25 July 1, 2006 July 1, 2009 December 31, 2010 12.79
2005 3Q 75.00 October 1, 2006 October 1, 2009 December 31, 2010 13.09
2005 4Q 68.75 January 1, 2007 January 1, 2010 December 31, 2010 14.48
2006 1Q 62.50 April 1, 2007 April 1, 2010 December 31, 2011 14.99
2006 2Q 56.25 July 1, 2007 July 1, 2010 December 31, 2011 18.02
2006 3Q 50.00 October 1, 2007 October 1, 2010 December 31, 2011 15.37
2006 4Q 43.75 January 1, 2008 January 1, 2011 December 31, 2011 15.38
2007 1Q 37.50 April 1, 2008 April 1, 2011 December 31, 2011 17.00
2007
(1)
6 618 934 6 000 2007 2Q 31.25 July 1, 2008 July 1, 2011 December 31, 2012 18.39
2007 3Q 25.00 October 1, 2008 October 1, 2011 December 31, 2012 21.86
2007 4Q — January 1, 2009 January 1, 2012 December 31, 2012 27.53
2008 1Q — April 1, 2009 April 1, 2012 December 31, 2013 24.15
2008 2Q — July 1, 2009 July 1, 2012 December 31, 2013 19.16
2008 3Q — October 1, 2009 October 1, 2012 December 31, 2013 17.80
2008 4Q — January 1, 2010 January 1, 2013 December 31, 2013 12.43
(1)
The Group’s current global stock option plans have a vesting schedule with a 25% vesting one
year after grant, and quarterly vesting thereafter, each of the quarterly lots representing 6.25% of
the total grant. The grants vest fully in four years.
F55
Notes to the Consolidated Financial Statements (Continued)