Nokia 2008 Annual Report Download - page 83
Download and view the complete annual report
Please find page 83 of the 2008 Nokia annual report below. You can navigate through the pages in the report by either clicking on the pages listed below, or by using the keyword search tool below to find specific information within the annual report.-
 1
1 -
2
-
3
-
4
-
5
-
6
-
7
-
8
-
9
-
10
-
11
-
12
-
13
-
14
-
15
-
16
-
17
-
18
-
19
-
20
-
21
-
22
-
23
-
24
-
25
-
26
-
27
-
28
-
29
-
30
-
31
-
32
-
33
-
34
-
35
-
36
-
37
-
38
-
39
-
40
-
41
-
42
-
43
-
44
-
45
-
46
-
47
-
48
-
49
-
50
-
51
-
52
-
53
-
54
-
55
-
56
-
57
-
58
-
59
-
60
-
61
-
62
-
63
-
64
-
65
-
66
-
67
-
68
-
69
-
70
-
71
-
72
-
 73
73 -
 74
74 -
 75
75 -
 76
76 -
 77
77 -
 78
78 -
 79
79 -
 80
80 -
 81
81 -
 82
82 -
 83
83 -
 84
84 -
 85
85 -
 86
86 -
 87
87 -
 88
88 -
 89
89 -
 90
90 -
 91
91 -
 92
92 -
 93
93 -
94
-
95
-
96
-
97
-
98
-
99
-
100
-
101
-
102
-
103
-
104
-
105
-
106
-
107
-
108
-
109
-
110
-
111
-
112
-
113
-
114
-
115
-
116
-
117
-
118
-
119
-
120
-
121
-
122
-
123
-
124
-
125
-
126
-
127
-
128
-
129
-
130
-
131
-
132
-
133
-
134
-
135
-
136
-
137
-
138
-
139
-
140
-
141
-
142
-
143
-
144
-
145
-
146
-
147
-
148
-
149
-
150
-
151
-
152
-
153
-
154
-
155
-
156
-
157
-
158
-
159
-
160
-
161
-
162
-
163
-
164
-
165
-
166
-
167
-
168
-
169
-
170
-
171
-
172
-
173
-
174
-
175
-
176
-
177
-
178
-
179
-
180
-
181
-
182
-
183
-
184
-
185
-
186
-
187
-
188
-
189
-
190
-
191
-
192
-
193
-
194
-
195
-
196
-
197
-
198
-
199
-
200
-
201
-
202
-
203
-
204
-
205
-
206
-
207
-
208
-
209
-
210
-
211
-
212
-
213
-
214
-
215
-
216
-
217
-
218
-
219
-
220
-
221
-
222
-
223
-
224
-
225
-
226
-
227
 |
 |

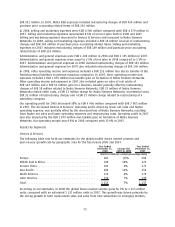
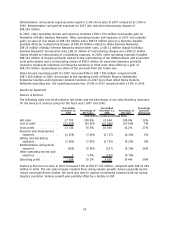
The following table sets forth our mobile device volumes and yearonyear growth rate by geographic
area for the fiscal years 2007 and 2006.
Year Ended
December 31,
2007
Change (%)
2006 to 2007
Year Ended
December 31,
2006
(Units in millions, except percentage data)
Europe .......................................... 117.2 17.7% 99.6
Middle East & Africa ................................ 75.6 42.1% 53.2
China ........................................... 70.7 38.6% 51.0
AsiaPacific. . ..................................... 112.9 41.5% 79.8
North America .................................... 19.4 (23.3)% 25.3
Latin America..................................... 41.3 7.0% 38.6
Total ............................................ 437.1 25.8% 347.5
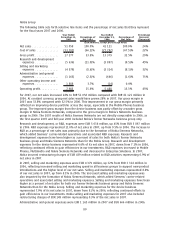
Devices & Services gross profit in 2007 was EUR 13 746 million, compared with EUR 10 836 million in
2006. This represented a gross margin of 36.5% in 2007, compared with a gross margin of 32.2% in
2006. This increase in gross margin was primarily due to newer and more profitable devices shipping
in volume.
Devices & Services R&D expenses in 2007 increased by 6% to EUR 2 879 million compared with
EUR 2 717 million in 2006. In 2007, R&D expenses represented 7.6% of Devices & Services net sales
compared with 8.1% of net sales in 2006. The increase reflected the extensive renewal of the product
portfolio and continuous introduction of new features in the products shipping in volumes in 2007.
In 2007, Devices & Services selling and marketing expenses increased by 8% to EUR 2 981 million,
compared with EUR 2 770 million in 2006. The increase resulted from increased sales and marketing
spend to support launches of new products, increased costs related to further development of the
distribution network and the growth of our business. In 2007, selling and marketing expenses
represented 7.9% of Devices & Services net sales, compared with 8.2% of its net sales in 2006.
In 2007, other operating income and expenses included EUR 57 million of restructuring charges and a
EUR 53 million gain on business transfer. In 2006, other operating expenses included EUR 142 million
of charges primarily related to the restructuring of the CDMA business and associated asset
writedowns.
In 2007, Devices & Services operating profit increased 56% to 7 584 EUR million compared with
EUR 4 865 million in 2006, with a 20.1% operating margin, up from 14.4% in 2006. The increase in
operating profit in 2007 was driven by an improved gross margin and growth in net sales of our
Multimedia products.
82