Nokia 2008 Annual Report Download - page 10
Download and view the complete annual report
Please find page 10 of the 2008 Nokia annual report below. You can navigate through the pages in the report by either clicking on the pages listed below, or by using the keyword search tool below to find specific information within the annual report.-
 1
1 -
 2
2 -
 3
3 -
 4
4 -
 5
5 -
 6
6 -
 7
7 -
 8
8 -
 9
9 -
 10
10 -
 11
11 -
 12
12 -
 13
13 -
 14
14 -
 15
15 -
 16
16 -
 17
17 -
 18
18 -
 19
19 -
 20
20 -
 21
21 -
22
-
23
-
24
-
25
-
26
-
27
-
28
-
29
-
30
-
31
-
32
-
33
-
34
-
35
-
36
-
37
-
38
-
39
-
40
-
41
-
42
-
43
-
44
-
45
-
46
-
47
-
48
-
49
-
50
-
51
-
52
-
53
-
54
-
55
-
56
-
57
-
58
-
59
-
60
-
61
-
62
-
63
-
64
-
65
-
66
-
67
-
68
-
69
-
70
-
71
-
72
-
73
-
74
-
75
-
76
-
77
-
78
-
79
-
80
-
81
-
82
-
83
-
84
-
85
-
86
-
87
-
88
-
89
-
90
-
91
-
92
-
93
-
94
-
95
-
96
-
97
-
98
-
99
-
100
-
101
-
102
-
103
-
104
-
105
-
106
-
107
-
108
-
109
-
110
-
111
-
112
-
113
-
114
-
115
-
116
-
117
-
118
-
119
-
120
-
121
-
122
-
123
-
124
-
125
-
126
-
127
-
128
-
129
-
130
-
131
-
132
-
133
-
134
-
135
-
136
-
137
-
138
-
139
-
140
-
141
-
142
-
143
-
144
-
145
-
146
-
147
-
148
-
149
-
150
-
151
-
152
-
153
-
154
-
155
-
156
-
157
-
158
-
159
-
160
-
161
-
162
-
163
-
164
-
165
-
166
-
167
-
168
-
169
-
170
-
171
-
172
-
173
-
174
-
175
-
176
-
177
-
178
-
179
-
180
-
181
-
182
-
183
-
184
-
185
-
186
-
187
-
188
-
189
-
190
-
191
-
192
-
193
-
194
-
195
-
196
-
197
-
198
-
199
-
200
-
201
-
202
-
203
-
204
-
205
-
206
-
207
-
208
-
209
-
210
-
211
-
212
-
213
-
214
-
215
-
216
-
217
-
218
-
219
-
220
-
221
-
222
-
223
-
224
-
225
-
226
-
227
 |
 |

Subject to exceptions relating to the right of minority shareholders to request for a certain minimum
distribution, the distribution may not exceed the amount proposed by the Board of Directors.
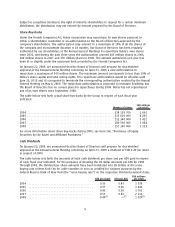
Share Buybacks
Under the Finnish Companies Act, Nokia Corporation may repurchase its own shares pursuant to
either a shareholders’ resolution or an authorization to the Board of Directors approved by the
company’s shareholders. The authorization may amount to a maximum of 10% of all the shares of
the company and its maximum duration is 18 months. Our Board of Directors has been regularly
authorized by our shareholders at the Annual General Meetings to repurchase Nokia’s own shares
since 2001, and during the past three years the authorization covered 405 million shares in 2006,
380 million shares in 2007 and 370 million shares in 2008. The amount authorized each year has
been at or slightly under the maximum limit provided by the Finnish Companies Act.
On January 22, 2009, we announced that the Board of Directors will propose for shareholders’
approval at the Annual General Meeting convening on April 23, 2009 a new authorization to
repurchase a maximum of 360 million shares. The maximum amount corresponds to less than 10% of
Nokia’s share capital and total voting rights. The repurchase authorization would be effective until
June 30, 2010 and it is proposed to terminate the corresponding authorization resolved by the Annual
General Meeting on May 8, 2008. The repurchase authorization is proposed to maintain flexibility, but
the Board of Directors has no current plans for repurchases during 2009. Nokia has not repurchased
any of its own shares since September 2008.
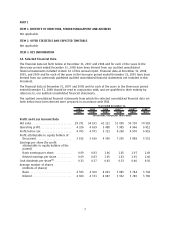
The table below sets forth actual share buybacks by the Group in respect of each fiscal year
indicated.
Number of shares
EUR millions
(in total)
2004 ..................................................... 214119700 2661
2005 ..................................................... 315010000 4265
2006 ..................................................... 212340000 3412
2007 ..................................................... 180590000 3884
2008 ..................................................... 157390000 3123
For more information about share buybacks during 2008, see Item 16E. “Purchases of Equity
Securities by the Issuer and Affiliated Purchasers.”
Cash Dividends
On January 22, 2009, we announced that the Board of Directors will propose for shareholders’
approval at the Annual General Meeting convening on April 23, 2009 a dividend of EUR 0.40 per share
in respect of 2008.
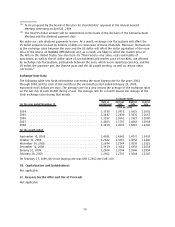
The table below sets forth the amounts of total cash dividends per share and per ADS paid in respect
of each fiscal year indicated. For the purposes of showing the US dollar amounts per ADS for 2004
through 2008, the dividend per share amounts have been translated into US dollars at the noon
buying rate in New York City for cable transfers in euro as certified for customs purposes by the
Federal Reserve Bank of New York (the “noon buying rate”) on the respective dividend payment dates.
EUR per share USD per ADS
EUR millions
(in total)
2004 .......................................... 0.33 0.43 1 539
2005 .......................................... 0.37 0.46 1 641
2006 .......................................... 0.43 0.58 1 761
2007 .......................................... 0.53 0.83 2 111
2008 .......................................... 0.40
(1)
—
(2)
1 520
(1)
9