Nokia 2008 Annual Report Download - page 217
Download and view the complete annual report
Please find page 217 of the 2008 Nokia annual report below. You can navigate through the pages in the report by either clicking on the pages listed below, or by using the keyword search tool below to find specific information within the annual report.-
 1
1 -
2
-
3
-
4
-
5
-
6
-
7
-
8
-
9
-
10
-
11
-
12
-
13
-
14
-
15
-
16
-
17
-
18
-
19
-
20
-
21
-
22
-
23
-
24
-
25
-
26
-
27
-
28
-
29
-
30
-
31
-
32
-
33
-
34
-
35
-
36
-
37
-
38
-
39
-
40
-
41
-
42
-
43
-
44
-
45
-
46
-
47
-
48
-
49
-
50
-
51
-
52
-
53
-
54
-
55
-
56
-
57
-
58
-
59
-
60
-
61
-
62
-
63
-
64
-
65
-
66
-
67
-
68
-
69
-
70
-
71
-
72
-
73
-
74
-
75
-
76
-
77
-
78
-
79
-
80
-
81
-
82
-
83
-
84
-
85
-
86
-
87
-
88
-
89
-
90
-
91
-
92
-
93
-
94
-
95
-
96
-
97
-
98
-
99
-
100
-
101
-
102
-
103
-
104
-
105
-
106
-
107
-
108
-
109
-
110
-
111
-
112
-
113
-
114
-
115
-
116
-
117
-
118
-
119
-
120
-
121
-
122
-
123
-
124
-
125
-
126
-
127
-
128
-
129
-
130
-
131
-
132
-
133
-
134
-
135
-
136
-
137
-
138
-
139
-
140
-
141
-
142
-
143
-
144
-
145
-
146
-
147
-
148
-
149
-
150
-
151
-
152
-
153
-
154
-
155
-
156
-
157
-
158
-
159
-
160
-
161
-
162
-
163
-
164
-
165
-
166
-
167
-
168
-
169
-
170
-
171
-
172
-
173
-
174
-
175
-
176
-
177
-
178
-
179
-
180
-
181
-
182
-
183
-
184
-
185
-
186
-
187
-
188
-
189
-
190
-
191
-
192
-
193
-
194
-
195
-
196
-
197
-
198
-
199
-
200
-
201
-
202
-
203
-
204
-
205
-
206
-
 207
207 -
 208
208 -
 209
209 -
 210
210 -
 211
211 -
 212
212 -
 213
213 -
 214
214 -
 215
215 -
 216
216 -
 217
217 -
 218
218 -
 219
219 -
 220
220 -
 221
221 -
 222
222 -
 223
223 -
 224
224 -
 225
225 -
 226
226 -
 227
227
 |
 |

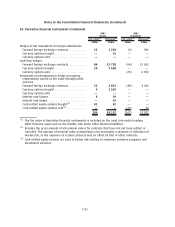
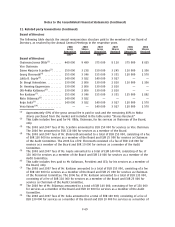
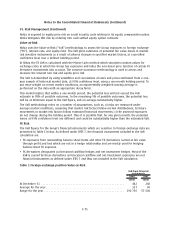
35. Risk Management (Continued)
on creating shareholder value. Treasury activities support this aim by: i) minimizing the adverse
effects caused by fluctuations in the financial markets on the profitability of the underlying
businesses; and ii) managing the capital structure of the Group by prudently balancing the levels of
liquid assets and financial borrowings.
Treasury activities are governed by policies approved by the CEO. Treasury Policy provides principles
for overall financial risk management and determines the allocation of responsibilities for financial
risk management in Nokia. Operating Procedures cover specific areas such as foreign exchange risk,
interest rate risk, use of derivative financial instruments, as well as liquidity and credit risk. Nokia is
risk averse in its Treasury activities.
(a) Market Risk
Foreign exchange risk
Nokia operates globally and is thus exposed to foreign exchange risk arising from various currencies.
Foreign currency denominated assets and liabilities together with expected cash flows from highly
probable purchases and sales contribute to foreign exchange exposure. These transaction exposures
are managed against various local currencies because of Nokia’s substantial production and sales
outside the Eurozone.
According to the foreign exchange policy guidelines of the Group, which remain the same as in the
previous year, material transaction foreign exchange exposures are hedged. Exposures are mainly
hedged with derivative financial instruments such as forward foreign exchange contracts and foreign
exchange options. The majority of financial instruments hedging foreign exchange risk have duration of
less than a year. The Group does not hedge forecasted foreign currency cash flows beyond two years.
Since Nokia has subsidiaries outside the Euro zone, the eurodenominated value of the shareholders’
equity of Nokia is also exposed to fluctuations in exchange rates. Equity changes resulting from
movements in foreign exchange rates are shown as a translation difference in the Group consolidation.
Nokia uses, from time to time, foreign exchange contracts and foreign currency denominated loans to
hedge its equity exposure arising from foreign net investments.
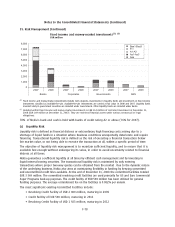
At the end of year 2008 and 2007, following currencies represent significant portion of the currency
mix in the outstanding financial instruments:
2008 USD JPY CNY INR
EURm EURm EURm EURm
FX derivatives used as cashflow hedges (net amount)
(1)
........... (3359) 2674 — (122)
FX derivatives used as net investment hedges (net amount)
(2)
...... (232) — (699) (179)
FX exposure from balance sheet items (net amount)
(3)
............ 729 (494) (579) 236
FX derivatives not designated in a hedge relationship and carried at
fair value through the profit and loss statement (net amount)
(3)
. . (615) 480 527 (443)
2007 USD JPY GBP INR
4
EURm EURm EURm EURm
FX derivatives used as cashflow hedges (net amount)
(1)
........... 803 1274 (656) (83)
FX derivatives used as net investment hedges (net amount)
(2)
...... — — — (216)
FX exposure from balance sheet items (net amount)
(3)
............ 2204 (739) 89 320
FX derivatives not designated in a hedge relationship and carried at
fair value through the profit and loss statement (net amount)
(3)
. . (2 361) 847 (127) (399)
F73
Notes to the Consolidated Financial Statements (Continued)