Nokia 2008 Annual Report Download - page 192
Download and view the complete annual report
Please find page 192 of the 2008 Nokia annual report below. You can navigate through the pages in the report by either clicking on the pages listed below, or by using the keyword search tool below to find specific information within the annual report.-
 1
1 -
2
-
3
-
4
-
5
-
6
-
7
-
8
-
9
-
10
-
11
-
12
-
13
-
14
-
15
-
16
-
17
-
18
-
19
-
20
-
21
-
22
-
23
-
24
-
25
-
26
-
27
-
28
-
29
-
30
-
31
-
32
-
33
-
34
-
35
-
36
-
37
-
38
-
39
-
40
-
41
-
42
-
43
-
44
-
45
-
46
-
47
-
48
-
49
-
50
-
51
-
52
-
53
-
54
-
55
-
56
-
57
-
58
-
59
-
60
-
61
-
62
-
63
-
64
-
65
-
66
-
67
-
68
-
69
-
70
-
71
-
72
-
73
-
74
-
75
-
76
-
77
-
78
-
79
-
80
-
81
-
82
-
83
-
84
-
85
-
86
-
87
-
88
-
89
-
90
-
91
-
92
-
93
-
94
-
95
-
96
-
97
-
98
-
99
-
100
-
101
-
102
-
103
-
104
-
105
-
106
-
107
-
108
-
109
-
110
-
111
-
112
-
113
-
114
-
115
-
116
-
117
-
118
-
119
-
120
-
121
-
122
-
123
-
124
-
125
-
126
-
127
-
128
-
129
-
130
-
131
-
132
-
133
-
134
-
135
-
136
-
137
-
138
-
139
-
140
-
141
-
142
-
143
-
144
-
145
-
146
-
147
-
148
-
149
-
150
-
151
-
152
-
153
-
154
-
155
-
156
-
157
-
158
-
159
-
160
-
161
-
162
-
163
-
164
-
165
-
166
-
167
-
168
-
169
-
170
-
171
-
172
-
173
-
174
-
175
-
176
-
177
-
178
-
179
-
180
-
181
-
 182
182 -
 183
183 -
 184
184 -
 185
185 -
 186
186 -
 187
187 -
 188
188 -
 189
189 -
 190
190 -
 191
191 -
 192
192 -
 193
193 -
 194
194 -
 195
195 -
 196
196 -
 197
197 -
 198
198 -
 199
199 -
 200
200 -
 201
201 -
 202
202 -
203
-
204
-
205
-
206
-
207
-
208
-
209
-
210
-
211
-
212
-
213
-
214
-
215
-
216
-
217
-
218
-
219
-
220
-
221
-
222
-
223
-
224
-
225
-
226
-
227
 |
 |

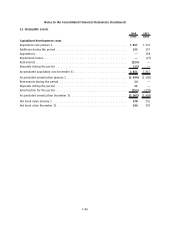
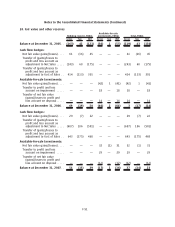
14. Investments in associated companies
2008 2007
EURm EURm
Net carrying amount January 1 .............................................. 325 224
Translation differences ..................................................... (19) —
Additions ............................................................... 24 19
Acquisitions . . ........................................................... —67
Deductions
(1)
............................................................ (239) (6)
Impairment . . ........................................................... (8) (7)
Share of results .......................................................... 644
Dividends ............................................................... (6) (12)
Other movements ........................................................ 13 (4)
Net carrying amount December 31 ........................................... 96 325
(1)
On December 2, 2008, the Group completed its acquisition of 52.1% of the outstanding common
stock of Symbian Ltd, a UKbased software licensing company. As a result of this acquisition, the
Group’s total ownership interest has increased from 47.9% to 100% of the outstanding common
stock of Symbian. See Note 8.
Shareholdings in associated companies are comprised of investments in unlisted companies in all
periods presented.
15. Availableforsale investments
Availableforsale investments included the following:
Current Noncurrent Current Noncurrent
2008 2007
EURm EURm EURm EURm
Fixed income and moneymarket investments carried at
fair value ...................................... 5 114 38 9 628 —
Available for sale investments in publicly quoted equity
shares ........................................ — 8—10
Other available for sale investments carried at fair value . . — 225 — 184
Other available for sale investments carried at cost less
impairment .................................... — 241 — 147
5 114 512 9 628 341
The current fixed income and money market investments, carried at fair value, included available for
sale liquid assets of EUR 1 272 million (EUR 4 903 million in 2007) and cash equivalents of EUR 3 842
million (EUR 4 725 million in 2007). See Note 35 for details of fixed income and money market
investments.
F48
Notes to the Consolidated Financial Statements (Continued)