Nokia 2008 Annual Report Download - page 65
Download and view the complete annual report
Please find page 65 of the 2008 Nokia annual report below. You can navigate through the pages in the report by either clicking on the pages listed below, or by using the keyword search tool below to find specific information within the annual report.-
 1
1 -
2
-
3
-
4
-
5
-
6
-
7
-
8
-
9
-
10
-
11
-
12
-
13
-
14
-
15
-
16
-
17
-
18
-
19
-
20
-
21
-
22
-
23
-
24
-
25
-
26
-
27
-
28
-
29
-
30
-
31
-
32
-
33
-
34
-
35
-
36
-
37
-
38
-
39
-
40
-
41
-
42
-
43
-
44
-
45
-
46
-
47
-
48
-
49
-
50
-
51
-
52
-
53
-
54
-
 55
55 -
 56
56 -
 57
57 -
 58
58 -
 59
59 -
 60
60 -
 61
61 -
 62
62 -
 63
63 -
 64
64 -
 65
65 -
 66
66 -
 67
67 -
 68
68 -
 69
69 -
 70
70 -
 71
71 -
 72
72 -
 73
73 -
 74
74 -
 75
75 -
76
-
77
-
78
-
79
-
80
-
81
-
82
-
83
-
84
-
85
-
86
-
87
-
88
-
89
-
90
-
91
-
92
-
93
-
94
-
95
-
96
-
97
-
98
-
99
-
100
-
101
-
102
-
103
-
104
-
105
-
106
-
107
-
108
-
109
-
110
-
111
-
112
-
113
-
114
-
115
-
116
-
117
-
118
-
119
-
120
-
121
-
122
-
123
-
124
-
125
-
126
-
127
-
128
-
129
-
130
-
131
-
132
-
133
-
134
-
135
-
136
-
137
-
138
-
139
-
140
-
141
-
142
-
143
-
144
-
145
-
146
-
147
-
148
-
149
-
150
-
151
-
152
-
153
-
154
-
155
-
156
-
157
-
158
-
159
-
160
-
161
-
162
-
163
-
164
-
165
-
166
-
167
-
168
-
169
-
170
-
171
-
172
-
173
-
174
-
175
-
176
-
177
-
178
-
179
-
180
-
181
-
182
-
183
-
184
-
185
-
186
-
187
-
188
-
189
-
190
-
191
-
192
-
193
-
194
-
195
-
196
-
197
-
198
-
199
-
200
-
201
-
202
-
203
-
204
-
205
-
206
-
207
-
208
-
209
-
210
-
211
-
212
-
213
-
214
-
215
-
216
-
217
-
218
-
219
-
220
-
221
-
222
-
223
-
224
-
225
-
226
-
227
 |
 |
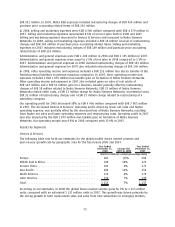
The magnitude of foreign exchange exposures changes over time as a function of our presence in
different markets and the prevalent currencies used for transactions in those markets. The majority of
our noneuro based sales are denominated in the US dollar, but Nokia’s strong presence in emerging
markets like China, India, Brazil and in Russia also gives rise to substantial foreign exchange exposure
in the Chinese yuan, Indian rupee, Brazilian real and Russian ruble. The majority of our noneuro
based purchases are denominated in US dollars and Japanese yen. In general, depreciation of another
currency relative to the euro has an adverse effect on our sales and operating profit, while
appreciation of another currency relative to the euro has a positive effect, with the exception of the
Japanese yen, being the only significant foreign currency in which we have more purchases than
sales.
To mitigate the impact of changes in exchange rates on net sales as well as average product cost, we
hedge material transaction exposures on a gross basis. Nokia hedges significant forecasted cash flows
typically with a 6 to 12 month hedging horizon. For the majority of these hedges hedge accounting is
applied to reduce profit and loss volatility. Nokia also hedges significant balance sheet exposures. Our
balance sheet is also affected by the translation into euro for financial reporting purposes of the
shareholders’ equity of our foreign subsidiaries that are denominated in currencies other than the
euro. In general, this translation increases our shareholders’ equity when the euro depreciates, and
affects shareholders’ equity adversely when the euro appreciates against the relevant other currencies
(yearend rate to previous yearend rate). To mitigate the impact to shareholders’ equity, Nokia
hedges selected net investment exposures from time to time.
During 2008, the volatility of the currency market was significantly higher than in 2007. At the same
time, the currency market liquidity was significantly lower in 2008, especially towards the end of the
year. This significantly increased our hedging cost and restricted our flexibility in hedging, particularly
with respect to certain emerging market currencies, in 2008.
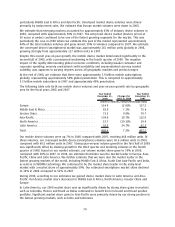
In 2008, until the end of July the US dollar depreciated against the euro by 6%. Since then, the US
dollar appreciated strongly and ended 4% higher at the end of 2008 than at the end of 2007. The
stronger US dollar towards the end of 2008 had a positive impact on our net sales expressed in euros
because approximately 50% of our net sales are generated in US dollars and currencies closely
following the US dollar. However, the appreciation of the US dollar also contributed to a higher
average product cost as approximately 50% of the components we use are sourced in the US dollar.
In total, the movements of the US dollar against the euro had a slightly positive impact on our
operating profit in 2008.
During 2008, the Japanese yen appreciated by 30% against the euro. As at the end of 2008
approximately 25% of the devices components we use were sourced in the Japanese yen, the
appreciation of the Japanese yen had a negative impact on our operating profit in 2008, which was
primarily offset by our currency hedges. The positive financial impact of our Japanese yen hedges
effective at the end of 2008 will end from the mid2009 onwards. We are taking action to reduce our
devices sourcing costs in the Japanese yen, including price negotiations with our suppliers and
shifting the sourcing of certain components to nonJapanese suppliers.
During 2008, the volatility of emerging market currencies was high especially towards the end of the
year when the Chinese yuan, Brazilian real, Indian rupee and Russian ruble depreciated 12%, 20%,
15% and 14%, respectively, against the euro. In general, the depreciation of an emerging market
currency has a negative impact on our operating profit due to reduced revenue in euro terms and/or
the reduced purchasing power of customers in the emerging market. The appreciation of an emerging
market currency generally has a positive impact on our operating profit.
Significant changes in exchange rates may also impact our competitive position and related price
pressures through their impact on our competitors. In 2008, the most notable of such impacts was
the depreciation of the Korean won by 29% against the US dollar and 27% against the euro which
benefitted our Koreabased competitors.
For a discussion on the instruments used by Nokia in connection with our hedging activities, see
64