Nokia 2008 Annual Report Download - page 209
Download and view the complete annual report
Please find page 209 of the 2008 Nokia annual report below. You can navigate through the pages in the report by either clicking on the pages listed below, or by using the keyword search tool below to find specific information within the annual report.-
 1
1 -
2
-
3
-
4
-
5
-
6
-
7
-
8
-
9
-
10
-
11
-
12
-
13
-
14
-
15
-
16
-
17
-
18
-
19
-
20
-
21
-
22
-
23
-
24
-
25
-
26
-
27
-
28
-
29
-
30
-
31
-
32
-
33
-
34
-
35
-
36
-
37
-
38
-
39
-
40
-
41
-
42
-
43
-
44
-
45
-
46
-
47
-
48
-
49
-
50
-
51
-
52
-
53
-
54
-
55
-
56
-
57
-
58
-
59
-
60
-
61
-
62
-
63
-
64
-
65
-
66
-
67
-
68
-
69
-
70
-
71
-
72
-
73
-
74
-
75
-
76
-
77
-
78
-
79
-
80
-
81
-
82
-
83
-
84
-
85
-
86
-
87
-
88
-
89
-
90
-
91
-
92
-
93
-
94
-
95
-
96
-
97
-
98
-
99
-
100
-
101
-
102
-
103
-
104
-
105
-
106
-
107
-
108
-
109
-
110
-
111
-
112
-
113
-
114
-
115
-
116
-
117
-
118
-
119
-
120
-
121
-
122
-
123
-
124
-
125
-
126
-
127
-
128
-
129
-
130
-
131
-
132
-
133
-
134
-
135
-
136
-
137
-
138
-
139
-
140
-
141
-
142
-
143
-
144
-
145
-
146
-
147
-
148
-
149
-
150
-
151
-
152
-
153
-
154
-
155
-
156
-
157
-
158
-
159
-
160
-
161
-
162
-
163
-
164
-
165
-
166
-
167
-
168
-
169
-
170
-
171
-
172
-
173
-
174
-
175
-
176
-
177
-
178
-
179
-
180
-
181
-
182
-
183
-
184
-
185
-
186
-
187
-
188
-
189
-
190
-
191
-
192
-
193
-
194
-
195
-
196
-
197
-
198
-
 199
199 -
 200
200 -
 201
201 -
 202
202 -
 203
203 -
 204
204 -
 205
205 -
 206
206 -
 207
207 -
 208
208 -
 209
209 -
 210
210 -
 211
211 -
 212
212 -
 213
213 -
 214
214 -
 215
215 -
 216
216 -
 217
217 -
 218
218 -
 219
219 -
220
-
221
-
222
-
223
-
224
-
225
-
226
-
227
 |
 |

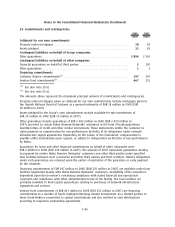
27. Provisions (Continued)
included EUR 402 million (EUR 318 million in 2007) impacting gross profit, EUR 46 million (EUR
439 million in 2007) research and development expenses, EUR 14 million of reversal of provision
(EUR 149 million expenses in 2007) in selling and marketing expenses, EUR 163 million (EUR
146 million in 2007) administrative expenses and EUR 49 million (EUR 58 million in 2007) other
operating expenses. EUR 790 million was paid during 2008 (EUR 254 million during 2007).
The IPR provision is based on estimated future settlements for asserted and unasserted past IPR
infringements. Final resolution of IPR claims generally occurs over several periods. In 2008,
EUR 379 million usage of the provisions mainly relates to the settlements with Qualcomm, Eastman
Kodak, Intertrust Technologies and ContentGuard.
Other provisions include provisions for noncancelable purchase commitments, provision for pension
and other social costs on sharebased awards and provision for losses on projects in progress.
28. Earnings per share
2008 2007 2006
Numerator/EURm
Basic/Diluted:
Profit attributable to equity holders of the parent ....... 3 988 7 205 4 306
Denominator/1000 shares
Basic:
Weighted average shares ........................... 3 743 622 3 885 408 4 062 833
Effect of dilutive securities:
Performance shares ............................. 25 997 26 304 17 264
Restricted shares................................ 6 543 3 693 3 601
Stock options .................................. 4 201 16 603 2 831
36 741 46 600 23 696
Diluted:
Adjusted weighted average shares and assumed
conversions .................................... 3 780 363 3 932 008 4 086 529
Under IAS 33, basic earnings per share is computed using the weighted average number of shares
outstanding during the period. Diluted earnings per share is computed using the weighted average
number of shares outstanding during the period plus the dilutive effect of stock options, restricted
shares and performance shares outstanding during the period.
Performance shares, restricted shares and stock options equivalent to 11 million shares were excluded
from the calculation of diluted earnings per share in 2008 as they were determined to be anti
dilutive. In 2007 and 2006, no shares were considered antidilutive.
F65
Notes to the Consolidated Financial Statements (Continued)