Nokia 2008 Annual Report Download - page 76
Download and view the complete annual report
Please find page 76 of the 2008 Nokia annual report below. You can navigate through the pages in the report by either clicking on the pages listed below, or by using the keyword search tool below to find specific information within the annual report.-
 1
1 -
2
-
3
-
4
-
5
-
6
-
7
-
8
-
9
-
10
-
11
-
12
-
13
-
14
-
15
-
16
-
17
-
18
-
19
-
20
-
21
-
22
-
23
-
24
-
25
-
26
-
27
-
28
-
29
-
30
-
31
-
32
-
33
-
34
-
35
-
36
-
37
-
38
-
39
-
40
-
41
-
42
-
43
-
44
-
45
-
46
-
47
-
48
-
49
-
50
-
51
-
52
-
53
-
54
-
55
-
56
-
57
-
58
-
59
-
60
-
61
-
62
-
63
-
64
-
65
-
 66
66 -
 67
67 -
 68
68 -
 69
69 -
 70
70 -
 71
71 -
 72
72 -
 73
73 -
 74
74 -
 75
75 -
 76
76 -
 77
77 -
 78
78 -
 79
79 -
 80
80 -
 81
81 -
 82
82 -
 83
83 -
 84
84 -
 85
85 -
 86
86 -
87
-
88
-
89
-
90
-
91
-
92
-
93
-
94
-
95
-
96
-
97
-
98
-
99
-
100
-
101
-
102
-
103
-
104
-
105
-
106
-
107
-
108
-
109
-
110
-
111
-
112
-
113
-
114
-
115
-
116
-
117
-
118
-
119
-
120
-
121
-
122
-
123
-
124
-
125
-
126
-
127
-
128
-
129
-
130
-
131
-
132
-
133
-
134
-
135
-
136
-
137
-
138
-
139
-
140
-
141
-
142
-
143
-
144
-
145
-
146
-
147
-
148
-
149
-
150
-
151
-
152
-
153
-
154
-
155
-
156
-
157
-
158
-
159
-
160
-
161
-
162
-
163
-
164
-
165
-
166
-
167
-
168
-
169
-
170
-
171
-
172
-
173
-
174
-
175
-
176
-
177
-
178
-
179
-
180
-
181
-
182
-
183
-
184
-
185
-
186
-
187
-
188
-
189
-
190
-
191
-
192
-
193
-
194
-
195
-
196
-
197
-
198
-
199
-
200
-
201
-
202
-
203
-
204
-
205
-
206
-
207
-
208
-
209
-
210
-
211
-
212
-
213
-
214
-
215
-
216
-
217
-
218
-
219
-
220
-
221
-
222
-
223
-
224
-
225
-
226
-
227
 |
 |

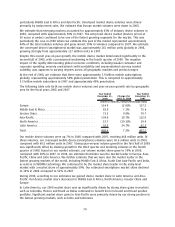
In Middle East & Africa, our market share declined in 2008 as a result of market share declines in
several markets, including South Africa, Nigeria and Iran. Our market share declined in North America
in 2008 primarily due to a market share decline in the US.
In Greater China, we continued to benefit from our brand, broad product portfolio and extensive
distribution system during 2008, but our market share fell partly due to price competition. In Europe,
our market share was slightly down. Nokia’s share increased in, for example, Italy, Russia and Poland,
but was more than offset by market share declines in Germany, Spain, France, Turkey and some other
countries.
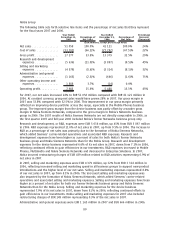
Our device ASP in 2008 was EUR 74, a decline of 14% from EUR 86 in 2007. Industry ASPs also
declined in 2008. Nokia’s lower ASP in 2008 compared to 2007 was primarily the result of a higher
proportion of lowerpriced entry level device sales where industry growth was strong.
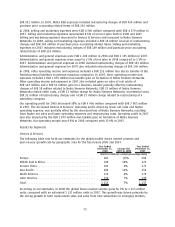
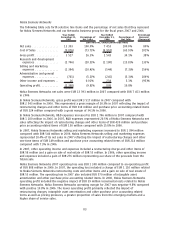
The following table sets forth selective line items and the percentage of net sales that they represent
for the Devices & Services group for the fiscal years 2008 and 2007.
Year Ended
December 31,
2008
Percentage of
Net Sales
Year Ended
December 31,
2007
Percentage of
Net Sales
Percentage
Increase/
(Decrease)
(EUR millions, except percentage data)
Net sales ................. 35099 100.0% 37 705 100.0% (7)%
Cost of sales .............. (22360) (63.7)% (23 959) (63.5)% (7)%
Gross profit ............... 12739 36.3% 13 746 36.5% (7)%
Research and development
expenses ............... (3127) (8.9)% (2 879) (7.6)% 9%
Selling and marketing
expenses ............... (2847) (8.1)% (2 981) (7.9)% (4)%
Administrative and general
expenses ............... (429) (1.2)% (303) (0.8)% 42%
Other operating income and
expenses ............... (520) (1.5)% 1 0.0%
Operating profit............ 5816 16.6% 7 584 20.1% (23)%
Devices & Services net sales in 2008 decreased 7% to EUR 35 099 million compared with
EUR 37 705 million in 2007. At constant currency, Devices & Services net sales would have decreased
by 2%. The net sales decrease was primarily due to strong volume growth in the first half of 2008
being significantly offset by slowing growth in the third quarter and declining volumes in the fourth
quarter of 2008. Further, the overall volume growth in 2008 was more than offset by a decline in ASP.
Net sales grew in Latin America. Net sales decreased in North America, Europe, Middle East & Africa,
AsiaPacific and Greater China. In 2008, services and software net sales contributed EUR 476 million of
our total Device & Services net sales.
Devices & Services gross profit in 2008 was EUR 12 739 million compared with EUR 13 746 million in
2007. This represented a gross margin of 36.3% in 2008 compared with a gross margin of 36.5% in
2007.
Devices & Services R&D expenses in 2008 increased by 9% to EUR 3 127 million compared with
EUR 2 879 million in 2007. In 2008, R&D expenses represented 8.9% of Devices & Services net sales
compared with 7.6% in 2007. The increase was mainly driven by further investments in software and
services. In 2008, Devices & Services R&D expenses included EUR 153 million representing the
contribution of the assets to the Symbian Foundation.
In 2008, Devices & Services selling and marketing expenses decreased by 4% to EUR 2 847 million
primarily as a result of increased focus on costefficiency of its selling and marketing efforts,
compared with EUR 2 981 million in 2007. In 2008, selling and marketing expenses represented 8.1%
of Devices & Services net sales compared with 7.9% of its net sales in 2007.
75