Nokia 2008 Annual Report Download - page 74
Download and view the complete annual report
Please find page 74 of the 2008 Nokia annual report below. You can navigate through the pages in the report by either clicking on the pages listed below, or by using the keyword search tool below to find specific information within the annual report.-
 1
1 -
2
-
3
-
4
-
5
-
6
-
7
-
8
-
9
-
10
-
11
-
12
-
13
-
14
-
15
-
16
-
17
-
18
-
19
-
20
-
21
-
22
-
23
-
24
-
25
-
26
-
27
-
28
-
29
-
30
-
31
-
32
-
33
-
34
-
35
-
36
-
37
-
38
-
39
-
40
-
41
-
42
-
43
-
44
-
45
-
46
-
47
-
48
-
49
-
50
-
51
-
52
-
53
-
54
-
55
-
56
-
57
-
58
-
59
-
60
-
61
-
62
-
63
-
 64
64 -
 65
65 -
 66
66 -
 67
67 -
 68
68 -
 69
69 -
 70
70 -
 71
71 -
 72
72 -
 73
73 -
 74
74 -
 75
75 -
 76
76 -
 77
77 -
 78
78 -
 79
79 -
 80
80 -
 81
81 -
 82
82 -
 83
83 -
 84
84 -
85
-
86
-
87
-
88
-
89
-
90
-
91
-
92
-
93
-
94
-
95
-
96
-
97
-
98
-
99
-
100
-
101
-
102
-
103
-
104
-
105
-
106
-
107
-
108
-
109
-
110
-
111
-
112
-
113
-
114
-
115
-
116
-
117
-
118
-
119
-
120
-
121
-
122
-
123
-
124
-
125
-
126
-
127
-
128
-
129
-
130
-
131
-
132
-
133
-
134
-
135
-
136
-
137
-
138
-
139
-
140
-
141
-
142
-
143
-
144
-
145
-
146
-
147
-
148
-
149
-
150
-
151
-
152
-
153
-
154
-
155
-
156
-
157
-
158
-
159
-
160
-
161
-
162
-
163
-
164
-
165
-
166
-
167
-
168
-
169
-
170
-
171
-
172
-
173
-
174
-
175
-
176
-
177
-
178
-
179
-
180
-
181
-
182
-
183
-
184
-
185
-
186
-
187
-
188
-
189
-
190
-
191
-
192
-
193
-
194
-
195
-
196
-
197
-
198
-
199
-
200
-
201
-
202
-
203
-
204
-
205
-
206
-
207
-
208
-
209
-
210
-
211
-
212
-
213
-
214
-
215
-
216
-
217
-
218
-
219
-
220
-
221
-
222
-
223
-
224
-
225
-
226
-
227
 |
 |

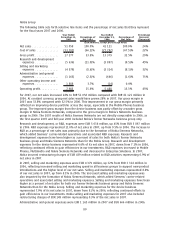
EUR 351 million. In 2007, Nokia R&D expenses included restructuring charges of EUR 439 million and
purchase price accounting related items of EUR 136 million.
In 2008, selling and marketing expenses were EUR 4 380 million compared with EUR 4 379 million in
2007. Selling and marketing expenses represented 8.6% of our net sales both in 2008 and 2007.
Selling and marketing expenses decreased in Devices & Services and increased in Nokia Siemens
Networks. In 2008, selling and marketing expenses included a EUR 14 million reversal of restructuring
charges and EUR 343 million of purchase price accounting related items. Selling and marketing
expenses for 2007 included restructuring charges of EUR 149 million and purchase price accounting
related items of EUR 214 million.
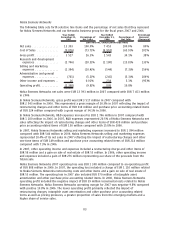
Administrative and general expenses were EUR 1 284 million in 2008 and EUR 1 165 million in 2007.
Administrative and general expenses were equal to 2.5% of net sales in 2008 compared to 2.3% in
2007. Administrative and general expenses in 2008 included restructuring charges of EUR 163 million.
Administrative and general expenses for 2007 also included restructuring charges of EUR 146 million.
In 2008, other operating income and expenses included a EUR 152 million loss due to transfer of the
Finnish pension liabilities to pension insurance companies. In 2007, other operating income and
expenses included a EUR 1 879 million nontaxable gain on formation of Nokia Siemens Networks.
Other operating income and expenses in 2007 also included gains on sales of real estate of
EUR 128 million and a EUR 53 million gain on a business transfer partially offset by restructuring
charges of EUR 58 million related to Nokia Siemens Networks, EUR 23 million of Nokia Siemens
Networks related other costs, a EUR 12 million charge for Nokia Siemens Networks’ incremental costs,
EUR 32 million of restructuring charges and a EUR 25 million charge related to restructuring of a
subsidiary company.
Our operating profit for 2008 decreased 38% to EUR 4 966 million compared with EUR 7 985 million
in 2007. The decreased Devices & Services’ operating profit, driven by lower net sales and higher
operating expense, was partially offset by the decreased loss of Nokia Siemens Networks, resulting
from higher net sales and lower operating expenses and restructuring costs. Operating profit in 2007
was also impacted by the EUR 1 879 million nontaxable gain on formation of Nokia Siemens
Networks. Our operating margin was 9.8% in 2008 compared with 15.6% in 2007.
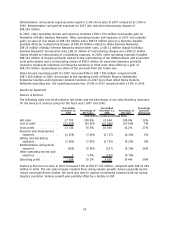
Results by Segments
Devices & Services
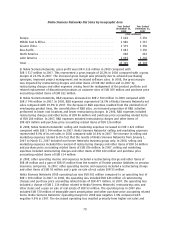
The following table sets forth our estimates for the global mobile device market volumes and
yearonyear growth rate by geographic area for the fiscal years 2008 and 2007.
Year Ended
December 31,
2008
Change (%)
2007 to 2008
Year Ended
December 31,
2007
(Units in millions, except percentage data)
Europe .......................................... 281 (1)% 284
Middle East & Africa ................................ 149 18% 126
Greater China ..................................... 183 6% 173
AsiaPacific. . ..................................... 284 12% 254
North America .................................... 178 4% 170
Latin America..................................... 139 7% 130
Total ............................................ 1213 7% 1137
According to our estimates, in 2008 the global device market volume grew by 7% to 1 213 million
units, compared with an estimated 1 137 million units in 2007. This growth was driven primarily by
the strong growth in both replacement sales and sales from new subscribers in emerging markets,
73