Nokia 2008 Annual Report Download - page 222
Download and view the complete annual report
Please find page 222 of the 2008 Nokia annual report below. You can navigate through the pages in the report by either clicking on the pages listed below, or by using the keyword search tool below to find specific information within the annual report.-
 1
1 -
2
-
3
-
4
-
5
-
6
-
7
-
8
-
9
-
10
-
11
-
12
-
13
-
14
-
15
-
16
-
17
-
18
-
19
-
20
-
21
-
22
-
23
-
24
-
25
-
26
-
27
-
28
-
29
-
30
-
31
-
32
-
33
-
34
-
35
-
36
-
37
-
38
-
39
-
40
-
41
-
42
-
43
-
44
-
45
-
46
-
47
-
48
-
49
-
50
-
51
-
52
-
53
-
54
-
55
-
56
-
57
-
58
-
59
-
60
-
61
-
62
-
63
-
64
-
65
-
66
-
67
-
68
-
69
-
70
-
71
-
72
-
73
-
74
-
75
-
76
-
77
-
78
-
79
-
80
-
81
-
82
-
83
-
84
-
85
-
86
-
87
-
88
-
89
-
90
-
91
-
92
-
93
-
94
-
95
-
96
-
97
-
98
-
99
-
100
-
101
-
102
-
103
-
104
-
105
-
106
-
107
-
108
-
109
-
110
-
111
-
112
-
113
-
114
-
115
-
116
-
117
-
118
-
119
-
120
-
121
-
122
-
123
-
124
-
125
-
126
-
127
-
128
-
129
-
130
-
131
-
132
-
133
-
134
-
135
-
136
-
137
-
138
-
139
-
140
-
141
-
142
-
143
-
144
-
145
-
146
-
147
-
148
-
149
-
150
-
151
-
152
-
153
-
154
-
155
-
156
-
157
-
158
-
159
-
160
-
161
-
162
-
163
-
164
-
165
-
166
-
167
-
168
-
169
-
170
-
171
-
172
-
173
-
174
-
175
-
176
-
177
-
178
-
179
-
180
-
181
-
182
-
183
-
184
-
185
-
186
-
187
-
188
-
189
-
190
-
191
-
192
-
193
-
194
-
195
-
196
-
197
-
198
-
199
-
200
-
201
-
202
-
203
-
204
-
205
-
206
-
207
-
208
-
209
-
210
-
211
-
 212
212 -
 213
213 -
 214
214 -
 215
215 -
 216
216 -
 217
217 -
 218
218 -
 219
219 -
 220
220 -
 221
221 -
 222
222 -
 223
223 -
 224
224 -
 225
225 -
 226
226 -
 227
227
 |
 |

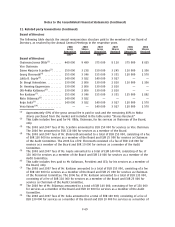
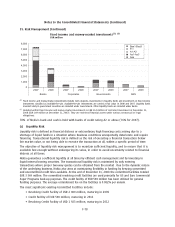
35. Risk Management (Continued)
Fixed income and moneymarket investments
(1), (2)
EUR million
0
1,000
2,000
3,000
4,000
5,000
6,000
7,000
8,000
2007 2008 2007 2008 2007 2008 2007 2008
Banks Corporates Governments ABS
Baa1-Baa3
P-1
A1-A3
Aa1-Aa3
Aaa
(1)
Fixed income and moneymarket investments include term deposits, investments in liquidity funds and investments in fixed income
instruments classified as Availableforsale. Availableforsale investments are carried at fair value in 2008 and 2007. Liquidity funds
invested solely in government securities are included under Governments. Other liquidity funds are included under Banks.
(2)
Included within fixed income and moneymarket investments is EUR 114 million of restricted investment at December 31,
2008 (EUR 169 million at December 31, 2007). They are restricted financial assets under various contractual or legal
obligations.
78% of Nokia’s bank and cash is held with banks of credit rating A2 or above (76% for 2007).
(c) Liquidity Risk
Liquidity risk is defined as financial distress or extraordinary high financing costs arising due to a
shortage of liquid funds in a situation where business conditions unexpectedly deteriorate and require
financing. Transactional liquidity risk is defined as the risk of executing a financial transaction below
fair market value, or not being able to execute the transaction at all, within a specific period of time.
The objective of liquidity risk management is to maintain sufficient liquidity, and to ensure that it is
available fast enough without endangering its value, in order to avoid uncertainty related to financial
distress at all times.
Nokia guarantees a sufficient liquidity at all times by efficient cash management and by investing in
liquid interest bearing securities. The transactional liquidity risk is minimized by only entering
transactions where proper twoway quotes can be obtained from the market . Due to the dynamic nature
of the underlying business, Nokia also aims at maintaining flexibility in funding by keeping committed
and uncommitted credit lines available. At the end of December 31, 2008 the committed facilities totaled
EUR 3 369 million. The committed revolving credit facilities are used primarily for US and Euro Commercial
Paper Programs backup purposes. The credit facility of EUR 500 million has been utilized for general
funding purposes. The average commitment fee on the facilities is 0.082% per annum.
The most significant existing Committed Facilities include:
• Revolving Credit Facility of USD 2 000 million, maturing in 2009
• Credit Facility of EUR 500 million, maturing in 2011
• Revolving Credit Facility of USD 1 923 million, maturing in 2012
F78
Notes to the Consolidated Financial Statements (Continued)