Nokia 2008 Annual Report Download - page 218
Download and view the complete annual report
Please find page 218 of the 2008 Nokia annual report below. You can navigate through the pages in the report by either clicking on the pages listed below, or by using the keyword search tool below to find specific information within the annual report.-
 1
1 -
2
-
3
-
4
-
5
-
6
-
7
-
8
-
9
-
10
-
11
-
12
-
13
-
14
-
15
-
16
-
17
-
18
-
19
-
20
-
21
-
22
-
23
-
24
-
25
-
26
-
27
-
28
-
29
-
30
-
31
-
32
-
33
-
34
-
35
-
36
-
37
-
38
-
39
-
40
-
41
-
42
-
43
-
44
-
45
-
46
-
47
-
48
-
49
-
50
-
51
-
52
-
53
-
54
-
55
-
56
-
57
-
58
-
59
-
60
-
61
-
62
-
63
-
64
-
65
-
66
-
67
-
68
-
69
-
70
-
71
-
72
-
73
-
74
-
75
-
76
-
77
-
78
-
79
-
80
-
81
-
82
-
83
-
84
-
85
-
86
-
87
-
88
-
89
-
90
-
91
-
92
-
93
-
94
-
95
-
96
-
97
-
98
-
99
-
100
-
101
-
102
-
103
-
104
-
105
-
106
-
107
-
108
-
109
-
110
-
111
-
112
-
113
-
114
-
115
-
116
-
117
-
118
-
119
-
120
-
121
-
122
-
123
-
124
-
125
-
126
-
127
-
128
-
129
-
130
-
131
-
132
-
133
-
134
-
135
-
136
-
137
-
138
-
139
-
140
-
141
-
142
-
143
-
144
-
145
-
146
-
147
-
148
-
149
-
150
-
151
-
152
-
153
-
154
-
155
-
156
-
157
-
158
-
159
-
160
-
161
-
162
-
163
-
164
-
165
-
166
-
167
-
168
-
169
-
170
-
171
-
172
-
173
-
174
-
175
-
176
-
177
-
178
-
179
-
180
-
181
-
182
-
183
-
184
-
185
-
186
-
187
-
188
-
189
-
190
-
191
-
192
-
193
-
194
-
195
-
196
-
197
-
198
-
199
-
200
-
201
-
202
-
203
-
204
-
205
-
206
-
207
-
 208
208 -
 209
209 -
 210
210 -
 211
211 -
 212
212 -
 213
213 -
 214
214 -
 215
215 -
 216
216 -
 217
217 -
 218
218 -
 219
219 -
 220
220 -
 221
221 -
 222
222 -
 223
223 -
 224
224 -
 225
225 -
 226
226 -
 227
227
 |
 |

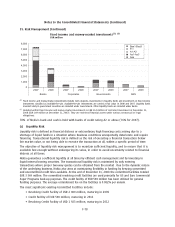
35. Risk Management (Continued)
(1)
The FX derivatives are used to hedge the foreign exchange risk from forecasted highly probably
cashflows related to sales, purchases and business acquisition activities. In some of the
currencies, especially in US Dollar, Nokia has substantial foreign exchange risks in both estimated
cash inflows and outflows, which have been netted in the table. See Note 20 for more details on
hedge accounting. The underlying exposures for which these hedges are entered into are not
presented in the table, as they are not financial instruments as defined under IFRS 7.
(2)
The FX derivatives are used to hedge the Group’s net investment exposure. The underlying
exposures for which these hedges are entered into are not presented in the table, as they are not
financial instruments as defined under IFRS 7.
(3)
The balance sheet items which are denominated in the foreign currencies are hedged by a portion
of FX derivatives not designated in a hedge relationship and carried at fair value through the profit
and loss statement, resulting in offsetting FX gains or losses in the financial income and expenses.
(4)
The INR amounts for 2007 have been revised as compared to previously published financial
statements due to a change in the way Nokia defines foreign exchange exposures.
Interest rate risk
The Group is exposed to interest rate risk either through market value fluctuations of balance sheet
items (i.e. price risk) or through changes in interest income or expenses (i.e. reinvestment risk).
Interest rate risk mainly arises through interest bearing liabilities and assets. Estimated future
changes in cash flows and balance sheet structure also expose the Group to interest rate risk.
The objective of interest rate risk management is to optimize the balance between minimizing
uncertainty caused by fluctuations in interest rates and maximizing the consolidated net interest
income and expense.
The interest rate exposure of the Group is monitored and managed centrally. Nokia uses the Valueat
Risk (VAR) methodology to assess and measure the interest rate risk of the net investments (cash and
investments less outstanding debt) and related derivatives.
As at the reporting date, the interest rate profile of the Group’s interestbearing assets and liabilities
is presented in the table below:
2008 2007
EURm EURm
Fixed rate assets . ....................................................... 2946 7750
Floating rate assets ..................................................... 4007 4205
Fixed rate liabilities ..................................................... 3604 712
Floating rate liabilities ................................................... 785 375
Equity price risk
Nokia is exposed to equity price risk as the result of market price fluctuations in the listed equity
instruments held mainly for strategic business reasons.
Nokia has certain strategic minority investments in publicly listed equity shares. The fair value of the
equity investments which are subject to equity price risk at December 31, 2008 was EUR 8 million
(EUR 10 million in 2007). In addition, Nokia invests in private equity through venture funds, which,
from time to time, may have holdings in equity instruments which are listed in stock exchanges.
These investments are classified as availableforsale carried at fair value. See Note 15 for more
details on available for sale investments.
Due to the insignificant amount of exposure to equity price risk, there are currently no outstanding
derivative financial instruments designated as hedges for these equity investments.
F74
Notes to the Consolidated Financial Statements (Continued)